 Analysis by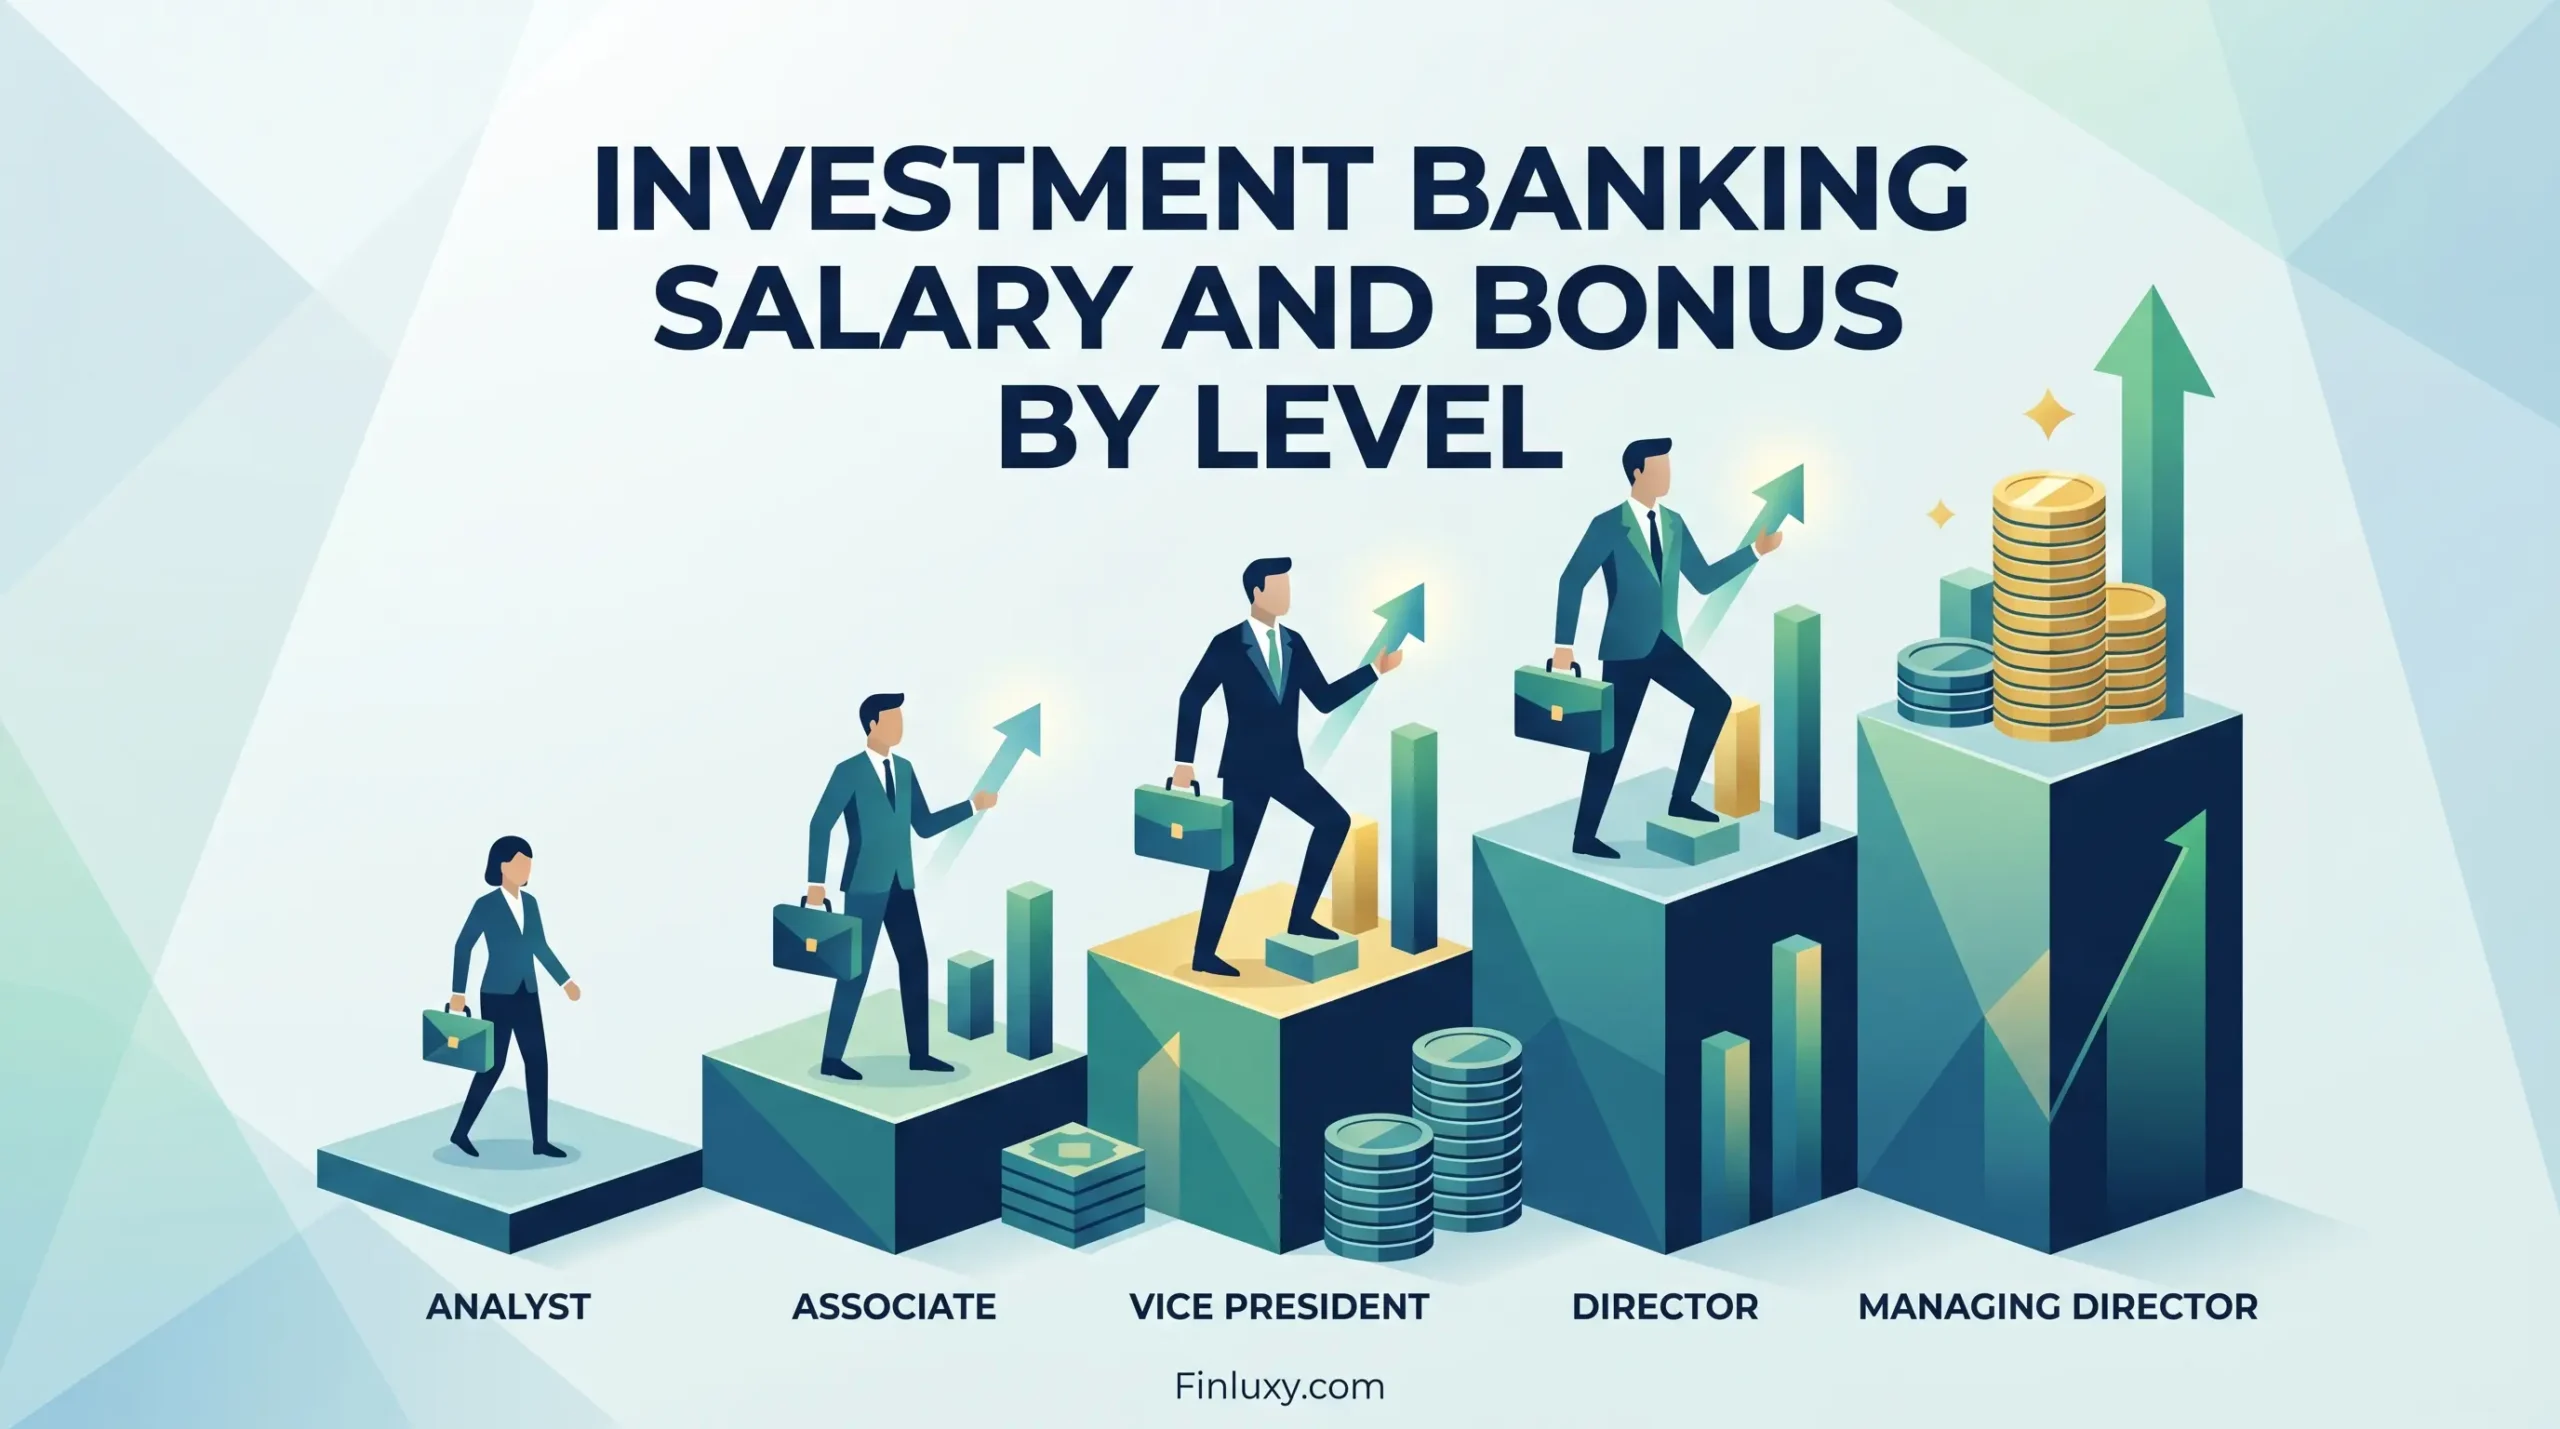
This analysis covers front-office investment banking compensation for New York-based roles at U.S. bulge bracket and elite boutique firms. Figures reflect 2025–2026 data from industry surveys and secondary sources; no primary BLS occupational code maps cleanly to investment banking exclusively (SOC 41-3031 covers all securities sales agents). Figures are pre-tax gross and exclude signing/relocation bonuses, stub bonuses, and benefits. Compensation is cyclical — bonus pools fluctuate materially with deal volume, and figures at mid-career and senior levels represent ranges, not guarantees. This is a data-driven cost analysis, not financial advice.
A first-year analyst at a bulge bracket bank earns more before their 23rd birthday than the median U.S. worker earns in nearly four years. That figure — $180,000 to $220,000 in total first-year compensation — is widely cited but rarely decomposed. What drives it, how it scales across a 20-year climb from analyst to managing director, and what the career earnings picture actually looks like: those are the questions worth answering with data.
Investment banking compensation has two levers: a base salary that moves in rare step-changes, and a bonus that swings dramatically based on deal volume, group performance, and individual bucket placement. The 2021 peak inflated both. The 2022–2023 drought cut total comp by 15–50% at the senior levels. Then 2024 and 2025 brought a partial recovery — M&A advisory fees rose 10–30% annually in each year, according to Mergers & Inquisitions’ 2026 compensation report, though most of that upside flowed to MDs rather than analysts and associates. Understanding which lever matters more at each career stage is the analytical core of this piece.
Key Numbers at a Glance
| Level | Base Salary | Total Comp (BB) | Total Comp (Elite Boutique) | Typical Years at Level |
|---|---|---|---|---|
| Analyst (Yr 1) | $110,000 | $180,000–$220,000 | $200,000–$250,000+ | 2–3 |
| Associate | $175,000–$225,000 | $275,000–$500,000 | $325,000–$550,000+ | 3–4 |
| Vice President | $250,000–$300,000 | $500,000–$700,000 | $575,000–$800,000+ | 3–4 |
| Director / SVP | $300,000–$350,000 | $600,000–$900,000 | $750,000–$1,100,000+ | 2–3 |
| Managing Director | $400,000–$600,000 | $800,000–$1,500,000+ | $1,000,000–$3,000,000+ | Indefinite |
Sources: Mergers & Inquisitions 2026 Update (April 2026); IB Interview Questions, Feb. 2026; Prospect Rock Partners 2024 Compensation Survey.
The Compensation Architecture: What You’re Actually Paid
Four components make up total investment banking compensation. Base salary is the floor — fixed, predictable, paid biweekly. It moved in one large step in 2021 (Goldman and peers pushed analyst bases from $85,000 to $100,000–$110,000) and has been largely static since. Year-end bonus is the variable layer, almost always 100% cash at the analyst level, shifting toward 10–20% deferral for associates, 20–30% for VPs, and 30–50% for MDs. That deferral structure matters because MDs earning $1.5 million gross often see $450,000–$750,000 of that locked in stock vesting over 3–4 years — meaningful liquidity risk if markets fall or the banker departs.
Stub bonuses apply when associates join mid-year out of MBA programs, typically set at 20–30% of first-year base. Signing bonuses run $10,000–$15,000 for analysts and $50,000–$60,000 for MBA associates, per Mergers & Inquisitions. Neither appears in the headline figures most people quote. Performance bucket placement — not title, not tenure — is the most direct predictor of bonus within a class. At most bulge brackets, two first-year analysts with identical $110,000 base salaries can finish $45,000 apart in total compensation based solely on whether they land in the top or mid bucket, according to IB Interview Questions (2026).
Level-by-Level Breakdown
Analyst: The Entry Math
At bulge bracket banks, first-year analyst base salaries run $110,000, with bonuses of $70,000–$110,000, producing total compensation of $180,000–$220,000, according to IB Interview Questions (Feb. 2026). Second-year analysts see bonuses rise to $85,000–$140,000, bringing total comp to $210,000–$265,000 at bulge brackets. Elite boutiques — Centerview, Evercore, PJT Partners — pay a 20–40% premium at junior levels; top-ranked year-one analysts at those firms have landed closer to $250,000. Middle-market banks (Houlihan Lokey, Piper Sandler, Lincoln International) typically come in 15–25% below bulge bracket totals, per IB Interview Questions (2026).
The hourly rate framing cuts through the glamour quickly. A first-year analyst earning $200,000 working 80-hour weeks clears roughly $48 per hour — about $6 more per hour than a management consultant on $120,000 at 55 hours, per IB Interview Questions (2026). That premium is real, but it’s much smaller than the headline comp gap implies.
Associate: Where the Step-Change Occurs
The jump from analyst to associate is the largest single-level base salary increase in the career ladder. Associates at bulge brackets earn $175,000–$225,000 in base, with total compensation spanning $275,000–$500,000 depending on class year and bucket. Prospect Rock Partners’ 2024 survey found second-year associates averaged $187,000 in base and approximately $134,000 in bonuses, for total comp around $321,000 at elite boutiques. For context: at strong boutiques, first-year associate totals were up 31% in 2024 versus 2023; second-year associates rose 33%.
Deferred compensation becomes a structural feature at this level. Associates typically have 10–20% of bonuses held in stock or deferred cash. It is not a dramatic haircut yet — that comes later — but it marks the point where gross and take-home begin to diverge meaningfully.
VP and Director: Revenue Exposure Begins
Vice presidents earn $250,000–$300,000 in base salary, with total compensation of $500,000–$700,000 at bulge brackets and toward $800,000 at elite boutiques. The 2025 bonus cycle was notably better for VPs and directors than for junior staff — Mergers & Inquisitions’ 2026 update reports total comp rising 10–15% for VPs and directors on end-of-year 2025 bonuses, versus only ~5% for analysts and associates. That divergence reflects the mechanics: at the VP level, individual revenue attribution starts to matter, and a strong deal year lifts VP bonuses faster than analyst pools.
Director compensation — the level between VP and MD that some firms call Senior Vice President or Executive Director — spans $300,000–$350,000 in base with total comp reaching $600,000–$900,000 at bulge brackets, higher at elite boutiques. Lazard has been cited as a Director compensation leader, with Prospect Rock Partners’ 2024 survey noting average director packages there around $841,667. Deferral at this level hits 20–30%, with the clock for liquidity events stretching 3–4 years out.
Managing Director: The Ceiling Is Firm-Specific
MD compensation is where the variance becomes the headline. Base salaries run $400,000–$600,000, but the bonus is the operative variable. At bulge brackets, total MD comp runs $800,000–$1,500,000 in a normal deal environment. Elite boutiques outpace that materially: Prospect Rock Partners’ 2024 survey found MD compensation at leading elite boutiques averaged over $1.7 million, up 68% from 2023. The top tier of confidential elite boutique firms — likely including Centerview and similarly structured advisory shops — reported average MD packages of $3,047,500 in 2024. Mergers & Inquisitions’ 2026 update pegs MD total comp growth at 25%+ on end-of-year 2025 bonuses.
The deferral structure matters most here. MDs with 30–50% of bonuses deferred face the most acute disconnect between gross and liquid compensation. A managing director at a top boutique generating $2 million in gross comp may realize $1.2 million in cash in year one, with the remainder vesting over subsequent years — subject to employment continuity, firm performance, and market conditions on unvested stock.
Firm Type Determines the Compensation Tier
| Level | Bulge Bracket Base | Bulge Bracket Total | Elite Boutique Total | Middle Market Total |
|---|---|---|---|---|
| Analyst (Yr 1) | $110,000 | $180,000–$220,000 | $200,000–$250,000+ | $150,000–$185,000 |
| Analyst (Yr 2) | $110,000 | $210,000–$265,000 | $250,000–$300,000+ | $170,000–$220,000 |
| Associate | $175,000–$225,000 | $275,000–$500,000 | $325,000–$550,000+ | $230,000–$380,000 |
| Vice President | $250,000–$300,000 | $500,000–$700,000 | $575,000–$800,000+ | $400,000–$550,000 |
| Managing Director | $400,000–$600,000 | $800,000–$1,500,000+ | $1,000,000–$3,000,000+ | $600,000–$1,200,000 |
Sources: IB Interview Questions (Feb. 2026); Mergers & Inquisitions 2026 Update; Prospect Rock Partners 2024 Compensation Survey; Mergers & Inquisitions 2023 table (structural reference for Director level).
The gap between firm tiers is not uniform across levels. At the analyst level, the elite boutique premium over bulge bracket is real but modest — $20,000–$30,000 in total comp at year one, expanding somewhat in year two. At the associate level, Prospect Rock Partners’ data puts elite boutique first-year associate totals 31–33% above 2023 levels, and firms like PJT Partners have been reported paying first-year associates approximately $400,000 in total compensation — well above the bulge bracket range. By the MD level, the gap between a top elite boutique and an underperforming bulge bracket group can exceed $1.5 million in a single year. Firm selection matters much more at senior levels than junior ones.
For private equity compensation, the calculus is different — carried interest structures make direct comparison with banking salaries methodologically complex.
The Overlooked Data Point: Bonus Cyclicality Swamps Level-to-Level Gains
Most compensation coverage focuses on the base-to-bonus ratio within a given year. The underreported story is how much bonus cyclicality dwarfs career-stage progression at senior levels. Consider: an MD at a bulge bracket earned an estimated $700,000–$1,500,000 total in 2021 (strong deal year), closer to $800,000–$1,000,000 in 2023 (weak deal year per Mergers & Inquisitions), and is now recovering toward $1,100,000–$1,500,000+ in 2025. That is a range of $700,000 across the business cycle — larger than a VP’s entire annual total comp in a normal year. The career-stage salary ladder is almost irrelevant relative to deal cycle timing at the MD level.
Junior bankers face the inverse problem. Analyst and associate bonus pools are set as a percentage of firm revenue, but junior staff represent a much smaller percentage of total comp expense. So when M&A fees rise 20–30%, MDs capture the upside disproportionately. The 2025 cycle made this explicit: revenue up 10–20%, analyst and associate total comp up ~5%, MD comp up 25%+, per Mergers & Inquisitions (April 2026). Junior bankers work in the same market that creates the bonus pool, but they hold minority economic interest in that pool.
Finluxy Career Earnings Index: Investment Banking
The Finluxy Career Earnings Index measures cumulative gross career earnings from career start to age 65, expressed as a multiple of national median career earnings. The national median baseline uses BLS May 2024 data: $49,500 annual median × 43 working years = $2,128,500 in gross career earnings for the median U.S. worker. All figures below are nominal, not NPV-adjusted — cohort cohort-specific discount rates would require assumptions about individual time preferences and opportunity costs beyond this data set.
| Career Stage | Years at Level | Midpoint Annual Comp | Subtotal (Gross) |
|---|---|---|---|
| Scenario A: Full Career to MD (Bulge Bracket) | |||
| Analyst | 3 | $200,000 | $600,000 |
| Associate | 3 | $375,000 | $1,125,000 |
| Vice President | 4 | $600,000 | $2,400,000 |
| Director | 3 | $750,000 | $2,250,000 |
| Managing Director | 30 | $1,100,000 | $33,000,000 |
| Total Career (43 years) | 43 | — | $39,375,000 |
| Finluxy Career Earnings Index | 18.5× national median career earnings | ||
| Scenario B: Exits at VP (Common Outcome — Private Equity or Corporate) | |||
| Analyst | 3 | $200,000 | $600,000 |
| Associate | 3 | $375,000 | $1,125,000 |
| Vice President (IB) | 4 | $600,000 | $2,400,000 |
| Post-IB (33 yrs, buy-side/corp. dev.) | 33 | $400,000 | $13,200,000 |
| Total Career (43 years) | 43 | — | $17,325,000 |
| Finluxy Career Earnings Index | 8.1× national median career earnings | ||
Sources: IB Interview Questions (Feb. 2026); Mergers & Inquisitions 2026 Update; BLS OEWS May 2024 (national median $49,500). Career stage durations from Mergers & Inquisitions (2023). Post-IB earnings in Scenario B use a conservative estimate for senior private equity compensation and corporate roles; actual figures vary substantially. Figures are nominal gross, not NPV-adjusted.
The Finluxy Career Earnings Index of 18.5× for the full MD career reflects the mathematical dominance of 30 MD years at $1.1 million midpoint. It is also the least realistic scenario — most analysts who enter investment banking do not make MD at a bulge bracket, and many who do make MD see significant annual variance around that $1.1 million midpoint. The 8.1× index for the VP-exit path is the more common outcome and still represents more than eight times the median U.S. worker’s lifetime gross earnings.
For comparison, physician compensation by specialty follows a different profile — high income concentrated in fewer years, constrained by the education and residency timeline. The IB MD path front-loads more senior earning years, with no equivalent to a physician’s post-residency attending salary step-change.
The Hidden Costs That Compress Net Compensation
Investment banking’s gross compensation figures require several downward adjustments before they map to wealth accumulation. New York City income tax adds roughly 4–5% on top of the combined federal and state effective rate, bringing the marginal rate for high earners in New York to approximately 50–55% on income above $500,000. A VP earning $600,000 gross in New York keeps approximately $300,000–$330,000 after tax.
Deferred compensation creates a second compression layer. That same VP, with 20–30% of bonus deferred, receives a portion of compensation as unvested stock or deferred cash instruments. The deferred amounts vest over 3–4 years — subject to employment continuity and, for stock compensation, equity price risk. This structure means the liquidity profile of a $600,000 gross package looks materially different from a $600,000 cash offer. Unlike Big Law attorney compensation, which is cash-heavy at the partnership level, senior IB compensation is structurally illiquid in ways that affect real financial planning.
There are no profession-specific recurring costs analogous to physician malpractice insurance (which can reach $20,000–$100,000 annually per specialty) or mandatory bar dues. The out-of-pocket overhead for a banker is low relative to peers in licensed professions — no continuing education requirements carry significant direct costs. The opportunity cost, however, is real: an MD working 70-hour weeks at $1.1 million is implicitly choosing against alternative deployments of that time.
Investment Banking vs. Comparable $150k+ Professions
| Profession | Entry-Level Total Comp | Senior-Level Total Comp | Finluxy Career Earnings Index (Illustrative) |
|---|---|---|---|
| IB Managing Director (full career) | $180,000–$220,000 | $800,000–$1,500,000+ | 18.5× |
| IB / Finance (VP exit, buy-side) | $180,000–$220,000 | $500,000–$700,000 | 8.1× |
| Management Consulting (MBB Partner) | $100,000–$120,000 | $800,000–$1,500,000+ | ~8–12× (est.) |
| Software Engineer (IC / Senior Staff) | $150,000–$200,000 | $400,000–$700,000+ | ~5–8× (est.) |
| Physician (Primary Care Attending) | $65,000 (residency) | $200,000–$280,000 | ~3× (Cluster Brief estimate) |
Sources: BLS OEWS May 2024; Mergers & Inquisitions 2026 Update; Finluxy Cluster Brief estimates for management consulting and software engineering (model-specific CEI verification pending for those articles). IB figures verified via Prospect Rock Partners 2024, IB Interview Questions 2026. Physician figures from Cluster Brief illustrative example using AAMC data structure. Management consulting and software engineering comparisons are illustrative — see dedicated profession pay guides for verified detail.
The comparison highlights investment banking’s structural advantage: very high income starts early (22–23 years old) and compounds across a long career. Software engineers also start high, but the compensation ceiling for individual contributors is lower than an IB MD’s median. MBB consulting partners approach similar senior-level figures, but the analyst starting salary is materially lower and the promotion timeline to partner longer.
Practical Context for $150k+ Households
For a household already earning $150,000 or more — evaluating whether to pursue investment banking, advise a family member entering finance, or contextualize a compensation offer — several thresholds are worth holding clearly. First: the analyst-level total comp of $180,000–$220,000 clears $150,000 handily, but in New York City, after tax and cost of living, the savings rate on an analyst salary is often below what households outside major metro areas assume. Second: the wealth accumulation story in investment banking is an MD story. The career earnings are overwhelmingly back-loaded. A banker who exits at VP — the most common outcome — has a strong earnings profile, but the 18.5× career earnings index is only accessible to the minority who reach and sustain MD status for multiple decades.
Third: deferred compensation and bonus cyclicality mean that gross figures overstate financial security at the senior level. An MD household with $1.5 million in gross comp, $600,000 deferred, $450,000 in federal and state taxes, and $150,000–$200,000 in New York living costs holds $250,000–$300,000 in free cash flow. That is substantial by any measure, but far from the $1.5 million gross headline. For households evaluating IB careers against attorney compensation paths, CPA career earnings, or pilot salary trajectories, the right frame is not headline gross but after-tax, after-deferral liquid income relative to hours — a calculation the headline compensation surveys systematically omit.
Households considering whether an MBA is worth financing to break into the associate level should note: the $50,000–$60,000 signing bonus partially offsets the opportunity cost of two years out of the workforce, but tuition at a top MBA program runs $80,000–$100,000 per year plus lost earnings. The NPV calculation on the MBA-to-associate path depends heavily on reaching VP and beyond — the payoff is real only if the career extends past the associate level, where the steep compensation curve fully materializes. For professions where the education premium is even more front-loaded, see the comparison between dentist vs. physician career earnings.
Frequently Asked Questions
What does a first-year investment banking analyst actually take home in New York?
A first-year analyst at a bulge bracket earns $110,000 in base salary and a bonus of $70,000–$110,000, for gross total compensation of $180,000–$220,000. After New York City and state income taxes plus federal taxes, the effective take-home is approximately $95,000–$115,000, depending on deductions and filing status. At 80-hour work weeks, that translates to roughly $23–$28 per hour in net cash — comparable to many professional roles with far more reasonable hours.
How much do elite boutiques pay compared to bulge bracket banks?
At the analyst level, the premium is modest: elite boutiques (Centerview, Evercore, PJT Partners) typically pay $20,000–$30,000 more in total first-year comp. At the associate level, the gap widens — PJT Partners has been reported at $400,000 total for first-year associates, versus $275,000–$350,000 at many bulge brackets. At the MD level, the divergence becomes dramatic: Prospect Rock Partners’ 2024 survey found leading elite boutiques averaging $3,047,500 in MD total comp, more than double the bulge bracket median range of $800,000–$1,500,000.
How does investment banking compensation compare to real estate or other finance careers?
Investment banking front-office compensation at mid-career and senior levels exceeds most other finance career paths except buy-side roles with meaningful carry. Real estate agent earnings at the top producer level can be substantial, but the median is far lower and commission-driven income is more volatile. CPA career earnings plateau earlier and at lower levels than senior IB roles. The closest comparable at the high end is private equity, where carried interest can produce multi-million-dollar payouts in strong vintage years — structures without a direct IB equivalent.
What percentage of analysts actually make it to managing director?
No major firm publishes analyst-to-MD retention rates, and survey data does not reliably track longitudinal career outcomes at the individual level. Mergers & Inquisitions and industry observers generally characterize the MD attainment rate as a small minority of those who enter at the analyst level — most exit after 2–3 years for private equity, hedge funds, or corporate roles. This matters significantly for the Finluxy Career Earnings Index: the 18.5× figure applies to a full MD career; the more common VP-exit scenario produces 8.1×.
How are investment banking bonuses structured and when are they paid?
Most banks pay analyst bonuses mid-year (typically January–March for the prior year’s performance). Associates and senior bankers receive year-end bonuses, often paid in January or February. The bonus has two components: a cash portion (100% for analysts, declining to 50–70% for MDs) and a deferred portion paid in stock or deferred cash vesting over 3–4 years. Performance bucket placement — top, mid, or low — determines the bonus magnitude within a level, producing swings of $45,000 between peers at the analyst level and much larger gaps at senior levels, per IB Interview Questions (2026).
Methodology
Compensation figures in this article reflect 2025–2026 data for front-office investment banking roles in New York City. Primary sourcing used the Mergers & Inquisitions 2026 compensation update (April 2026), IB Interview Questions (February 2026, updated May 2026), and Prospect Rock Partners’ 2024 Investment Banking Compensation Survey. BLS OEWS May 2024 data for SOC 41-3031 (Securities, Commodities, and Financial Services Sales Agents) was used for the national median wage baseline ($49,500 for all workers; $78,140 median for the broader occupational category) and for the Finluxy Career Earnings Index denominator. BLS SOC 41-3031 covers brokers broadly and includes roles below the investment banking front-office tier — the BLS figures are not used as primary IB compensation benchmarks for that reason.
The Finluxy Career Earnings Index uses the BLS May 2024 all-occupations median of $49,500 × 43 working years = $2,128,500 as the national median career earnings denominator. Career stage durations follow Mergers & Inquisitions’ published typical age ranges (analyst 2–3 years, associate 3–4 years, VP 3–4 years, director 2–3 years). All figures are nominal gross earnings, not NPV-adjusted. Scenario B post-IB earnings ($400,000 midpoint) are a conservative estimate for experienced finance professionals in buy-side or corporate development roles — this figure is not sourced to a specific primary dataset and should be treated as directional. Sources flagged as unavailable or paywalled were not used as primary inputs; ranges were derived from the highest-quality openly available survey data and cross-checked across at least two sources.
Sources & References
- Mergers & Inquisitions — Investment Banker Salary and Bonus Report: 2026 Update (April 2026)
- IB Interview Questions — Investment Banking Salary & Bonus: Analyst to MD Compensation (Feb. 2026, updated May 2026)
- Prospect Rock Partners — Investment Banking Compensation 2024: Who Paid the Most (2024)
- BLS Occupational Outlook Handbook — Securities, Commodities, and Financial Services Sales Agents, May 2024
- BLS Occupational Employment and Wage Statistics — National Median Annual Wage, May 2024 ($49,500)
- Wall Street Prep — Investment Banking Analyst Salary Guide (Nov. 2024)
- Prospect Rock Partners — Investment Banking Analyst Compensation Report: 2025 Market Analysis