 Analysis by
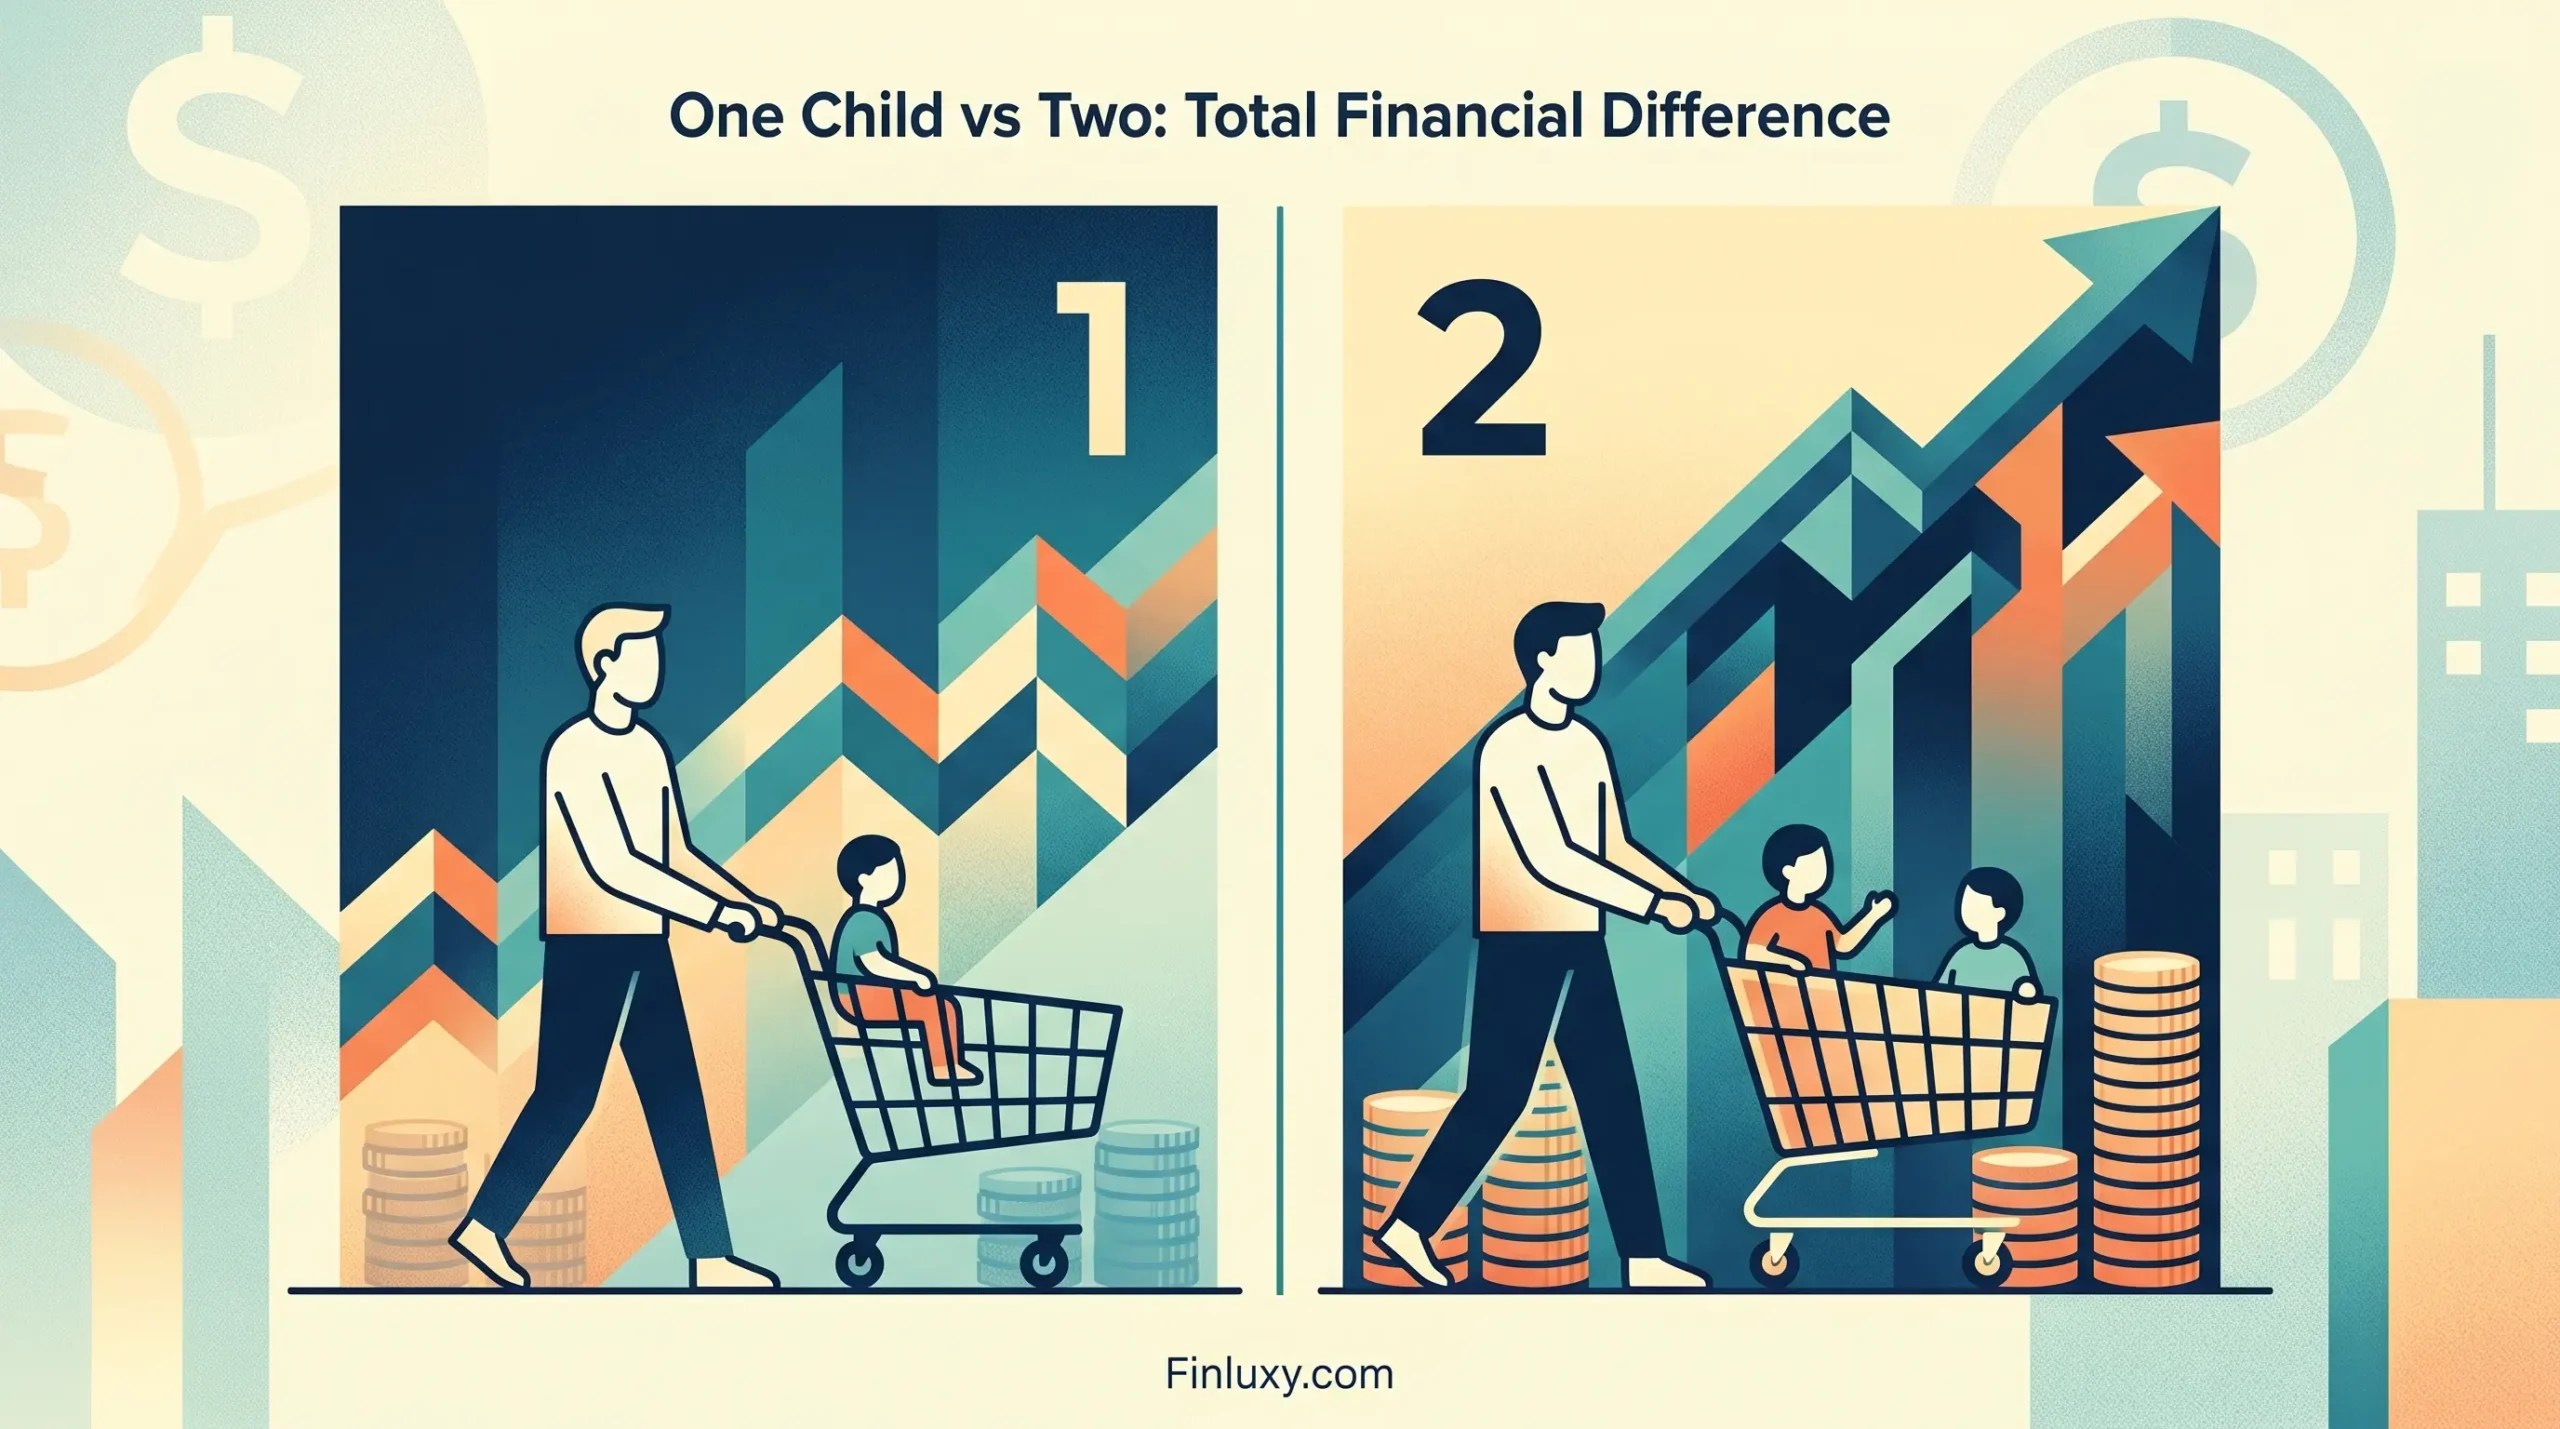
Adding a second child to a $150k+ household doesn’t double your child-rearing cost — but it adds roughly $375,000 over 18 years, before a single dollar of college tuition. That figure sits at the center of a decision most financial coverage treats as a lifestyle choice rather than a calculable cost differential. The data disagrees.
This analysis builds the one-child vs. two-child cost comparison from primary data: the United States Department of Agriculture (USDA) Expenditures on Children by Families report, the most authoritative source on child-rearing cost in the U.S., combined with College Board tuition data and Bureau of Labor Statistics CPI figures for inflation adjustment. The goal is a number you can actually use, not a range so wide it tells you nothing.
Scope and limitations: All child-rearing cost figures are derived from the USDA’s 2015 Expenditures on Children by Families report (Lino et al., January 2017, revised March 2017) — the most recent edition published; the USDA discontinued the series after this edition. Dollar figures are expressed in inflation-adjusted 2025 terms using CPI-U data from the Bureau of Labor Statistics. Upper-income figures reflect the USDA’s highest income bracket (before-tax household income above $107,400 in 2015 dollars), which is the closest available data tier for $150k+ households. The analysis covers child-rearing cost from birth through age 17 and excludes college costs, which are modeled separately. Individual household results will vary based on region, childcare arrangements, school choice, and spending patterns.
Key Numbers at a Glance
| Metric | One Child | Two Children |
|---|---|---|
| Finluxy 18-Year Child Cost Estimate (birth–age 17, excl. college) | $652,335 | $1,027,300 combined |
| Incremental cost of second child vs. first child only | — | $374,965 |
| 4-Year Private University Total Cost of Attendance (2025-26 rates) | $261,880 | $523,760 combined |
| Child Tax Credit value per child (2025, married filing jointly ≤$400k MAGI) | $2,200/yr | $4,400/yr combined |
| Estimated total household cost through college (birth–age 22) | ~$914,000 | ~$1,551,000 combined |
Sources: USDA Expenditures on Children by Families, 2015 (Lino et al., January 2017); Bureau of Labor Statistics CPI-U data; College Board Trends in College Pricing and Student Aid 2025; IRS/Congressional Research Service (2025). Figures in 2025 dollars where applicable.
The Finluxy 18-Year Child Cost Estimate
The USDA’s 2015 Expenditures on Children by Families report puts the 18-year child-rearing cost for upper-income households — defined as before-tax income above $107,400 in 2015 dollars — at $372,210 per child in a standard two-child married-couple family. That figure does not include college. Adjusted for cumulative CPI-U inflation from 2015 through 2025 (approximately 38%, per Bureau of Labor Statistics data), the 2025-dollar equivalent is roughly $513,650 per child in a two-child household.
That per-child number isn’t the same for a one-child family, and this is where most coverage stops short. The USDA explicitly reports that expenditures in a one-child household average 27% higher per child than in a two-child family — a result of lost economies of scale across housing, food, childcare, and transportation. Apply that adjustment and the Finluxy 18-Year Child Cost Estimate for an only child reaches approximately $652,335 in 2025 dollars.
Two children in the same upper-income household cost $513,650 each, for a combined total of approximately $1,027,300. The incremental cost of the second child — that is, what moving from one to two actually adds to the household’s 18-year bill — is therefore roughly $374,965. That’s the marginal price of the second child after accounting for the economies of scale that reduce per-child spending across the board when two children share housing, hand-me-down clothing, and purchased care.
| Household Configuration | Per-Child Cost (2025 $) | Total Household Cost (2025 $) | USDA Adjustment Applied |
|---|---|---|---|
| One child (only child) | $652,335 | $652,335 | +27% vs. two-child baseline |
| Two children (standard USDA baseline) | $513,650 | $1,027,300 | None (baseline) |
| Marginal cost of second child | — | $374,965 | Difference: two-child total minus one-child total |
Sources: USDA Expenditures on Children by Families, 2015 (Lino et al., January 2017, revised March 2017); BLS CPI-U inflation data (2015–2025, approx. 38% cumulative). Upper income defined as before-tax household income above $107,400 (2015 dollars). USDA series was discontinued after this edition; no updated government equivalent has been published.
What Drives the Cost Difference — Component by Component
Housing is the dominant category and the one where economies of scale cut deepest. For upper-income families in the USDA dataset, housing represents the largest single component of child-rearing cost — roughly 26–33% of the total depending on income tier. A two-bedroom home that accommodates one child often requires little structural change to accommodate two, particularly when children are close in age and can share a room. That shared square footage is precisely why per-child housing costs drop significantly with a second child.
Childcare behaves differently. Infants and toddlers carry the highest annual childcare costs of any age group, and the USDA data confirms that child care and education account for a disproportionately large share of upper-income spending — approximately 23% of total child-rearing cost for high-income families, compared to 16% for middle-income households. If both children require paid childcare simultaneously, the second child produces limited savings in this category. Sibling discounts at daycare centers exist but are typically 10–15% rather than the larger housing savings.
Food, transportation, and clothing do scale more favorably. Food purchased in larger quantities, hand-me-down clothing, and transportation costs that don’t double when a second car trip accommodates two passengers rather than one — these are the categories where the “cheaper by the dozen effect,” as USDA economist Mark Lino labeled it, materializes most reliably. For a deeper look at how these numbers break down year by year, the annual cost of a child ages 1 to 18 shows how the composition shifts across the child’s development.
| Budget Category | Upper Income Share | Middle Income Share |
|---|---|---|
| Housing | ~26% | ~29% |
| Child Care & Education | ~23% | ~16% |
| Food | ~16% | ~18% |
| Transportation | ~14% | ~15% |
| Healthcare | ~7% | ~9% |
| Clothing | ~6% | ~6% |
| Miscellaneous | ~8% | ~7% |
Source: USDA Expenditures on Children by Families, 2015 (Lino et al., January 2017). Percentages are approximate; USDA data for upper income reports higher childcare/education share than middle income. Individual shares may not sum to 100% due to rounding.
The practical implication: if your household relies heavily on paid childcare for the early years — which upper-income dual-income families typically do — the second child’s cost savings are smaller than the USDA’s aggregate 27% premium suggests, because the premium is diluted by simultaneous childcare spending. Families with a stay-at-home parent see more of those economies. For full context on how second child costs differ from the first, including childcare overlap scenarios, that analysis breaks it down further.
The College Layer: Doubling the Sticker Price
The USDA figures cover birth through age 17 and explicitly exclude college. For $150k+ households targeting a four-year private university, that’s a substantial additional line item that doesn’t benefit from the same economies of scale.
According to the College Board’s Trends in College Pricing and Student Aid 2025 report, the average total cost of attendance at a private nonprofit four-year institution in 2025-26 — including tuition, fees, room, and board — is $65,470 per year. Over four years, that’s $261,880 at current prices. Two children means $523,760, and that’s before applying any inflation to future years of enrollment. Families who want to project the actual cost of college tuition 15–18 years forward will need to layer in a tuition inflation assumption; the College Board data shows private nonprofit tuition growing roughly 4% annually before inflation in recent years, which compounds significantly over an 18-year horizon. The 529 plan contribution strategy from birth analysis models exactly how much monthly savings each scenario requires.
At $150k household income, neither child in a two-child household is likely to receive significant need-based aid at elite private institutions. The College Board reports that the average net tuition and fees at private nonprofits for first-time full-time students was approximately $16,910 (in 2025 dollars) in 2025-26 after grant aid — but that average heavily reflects lower-income students. High-income families are largely paying sticker. For the purposes of this analysis, the college cost figures use published cost of attendance without discounting for aid.
The Tax Credit Offset — and Why It’s Modest at This Income
The Child Tax Credit under current law (as modified by the One Big Beautiful Bill Act of 2025) is $2,200 per qualifying child under age 17 in tax year 2025, with a phase-out beginning at $400,000 modified adjusted gross income for married couples filing jointly. A $150k household receives the full $2,200 per child. One child generates $2,200 annually in credit; two children generate $4,400. Per the Congressional Research Service (2025), the credit reduces by $50 for every $1,000 of MAGI above the $400,000 threshold for joint filers, so most $150k–$400k households receive the full benefit.
Over 17 years of eligibility (the credit applies through age 16), one child generates a cumulative credit value of $37,400 at the 2025 rate. Two children generate $74,800 — a difference of $37,400. That additional credit partially offsets the $374,965 marginal cost of the second child calculated above, covering roughly 10 cents of every dollar of incremental child-rearing cost. For a more detailed breakdown of the credit by income tier, the Child Tax Credit value at $150k to $400k income analysis runs through the phase-out math precisely.
The Overlooked Factor: Childcare’s Disproportionate Drag on the Two-Child Premium
Most coverage of the one-child vs. two-child cost question treats the USDA’s 27% one-child premium as a settled fact — more expensive to have one than two, per child, full stop. What the data actually shows is more conditional than that. The 27% figure is an average across all upper-income families in the USDA dataset, which includes both dual-income households paying full market-rate childcare and households where a parent provides care directly. For $150k+ dual-income families — the majority of households at that income level — the childcare category suppresses the economy-of-scale effect significantly during the first five years of each child’s life.
When two children are in paid childcare simultaneously (a common scenario when children are two to three years apart), the household is paying two separate childcare bills. The USDA’s 23% childcare-and-education share for upper-income families translates to roughly $118,000 of the inflation-adjusted $513,650 two-child per-child estimate. Two children in overlapping paid childcare windows means that $118,000 figure roughly doubles for the overlap period rather than scaling downward. The economy of scale that appears clearly in housing and food is partially offset by this effect.
The practical implication: a $150k household where both parents work full-time and space children two to three years apart should model a marginal second-child cost closer to $400,000–$430,000 rather than the $374,965 aggregate figure, because childcare overlap during the infant and toddler years eliminates most of the scale benefit in the largest discretionary cost category. The income impact of parental leave decisions intersects here, since a longer leave for the second child reduces paid childcare duration and changes the math.
Opportunity Cost: The Number the USDA Doesn’t Count
The USDA analysis covers direct household expenditures. It deliberately excludes indirect costs — specifically, forgone earnings and career opportunity costs when a parent reduces work hours or exits the workforce during the early years. For $150k+ households, this is often the largest single financial consequence of having a child, and it compounds with a second.
A parent earning $80,000 annually who reduces to part-time (50% of hours) for the first three years of an infant’s life forgoes approximately $120,000 in gross income before accounting for any career trajectory effects. If that same pattern repeats for a second child — as it typically does — the household absorbs another $120,000 in direct income sacrifice, plus any compounding effect of reduced seniority, bonus eligibility, or promotion trajectory during the second leave period. The maternity and paternity leave income impact analysis models several scenarios for dual-income $150k+ households, including full leave, partial leave, and the cost of each additional child on total five-year earning capacity.
The USDA’s $374,965 marginal cost figure does not include any of this. Households where career interruption accompanies each child should add an opportunity cost estimate — ranging from $0 for families with covered leave and no work reduction to well over $200,000 for a parent who steps back significantly for both children — to arrive at the full economic picture.
What the Total Picture Looks Like for a $150k+ Household
Pulling the threads together: a $150k+ household with one child can expect approximately $652,335 in child-rearing cost through age 17 (Finluxy 18-Year Child Cost Estimate, 2025 dollars), plus roughly $261,880 in college cost at private nonprofit rates, for a birth-to-graduation total of approximately $914,000. That figure excludes opportunity cost, birth cost, and any graduate or professional school funding.
Adding a second child brings the combined 18-year child-rearing cost to approximately $1,027,300, plus $523,760 for two private university educations — a birth-to-graduation total of approximately $1,551,000 for both children. The marginal cost of that decision — moving from one child to two — is roughly $637,000 in today’s dollars when child-rearing costs and private university attendance are both included, offset by an additional $37,400 in Child Tax Credit value over 17 years. For context on the full cost framework from the beginning, the complete guide to the cost of having a child for $150k+ families covers each stage from birth costs through college.
Birth costs themselves are an additional consideration that precedes these 18-year figures. A vaginal delivery and a cesarean carry meaningfully different out-of-pocket costs depending on insurance plan structure. The hospital birth cost breakdown by delivery type shows what each scenario typically costs under common insurance configurations, and those costs apply twice in a two-child household. Similarly, families who face fertility treatment costs before either pregnancy should layer those figures in before the 18-year clock starts.
The decision carries real thresholds for households at this income level. Two children at private universities simultaneously — a four-year overlap window — creates a college funding peak that can exceed $130,000 in a single year at current rates. That concentration of cost, not the 18-year average, is what stress-tests household cash flow most severely. Households planning for two children should be modeling 529 plan contributions from the first child’s birth, not the second’s. The 529 plan savings strategy from birth analysis shows the monthly contribution required to cover private university costs for each child under several inflation and return assumptions. For comparison, the cost picture for households below the $150k threshold — where the USDA income tiers produce materially different results — is covered in the 18-year child cost middle-income analysis.
Methodology
Child-rearing cost figures use the USDA Expenditures on Children by Families, 2015 (Lino, Kuczynski, Rodriguez, and Schap; U.S. Department of Agriculture Center for Nutrition Policy and Promotion, January 2017, revised March 2017). This is the final edition of the series; USDA discontinued publication after 2017. The upper-income bracket in the USDA report is defined as before-tax household income above $107,400 in 2015 dollars. All USDA figures were inflation-adjusted from 2015 to 2025 dollars using a cumulative CPI-U factor of approximately 38%, derived from Bureau of Labor Statistics Consumer Price Index data (calculatorsoup.com CPI calculator sourcing BLS data). The one-child adjustment factor (+27% per child relative to the two-child baseline) and the three-or-more-children factor (−24% per child) are sourced directly from the USDA 2017 press release and confirmed in the full report text. College cost figures are from the College Board Trends in College Pricing and Student Aid 2025 report (November 2025), using the published total cost of attendance for private nonprofit four-year institutions ($65,470 for 2025-26). Child Tax Credit figures reflect the One Big Beautiful Bill Act of 2025 and are confirmed against the Congressional Research Service report R41873 and IRS.gov (2025). No parenting blog estimates, brand-published cost figures, or unattributed secondary aggregations were used.
Frequently Asked Questions
Does the second child always cost less per child than the first?
On average, yes — the USDA reports that per-child spending in a two-child household is 27% lower than in a one-child household, reflecting economies of scale in housing, food, and transportation. However, this average masks significant variation. Dual-income households where both children require paid childcare simultaneously during overlapping years may see little or no savings in that category, which accounts for approximately 23% of upper-income child-rearing cost. The 27% average applies most cleanly to households where childcare costs are limited or where children are spaced widely enough to avoid simultaneous paid care.
Does the Child Tax Credit meaningfully offset the cost difference?
At $150k household income, the full $2,200 per-child credit applies (the phase-out begins at $400,000 MAGI for married filing jointly under current 2025 law). The additional credit for a second child — $2,200 per year over approximately 17 years of eligibility — totals roughly $37,400. Against a marginal second-child cost of approximately $374,965 over 18 years (before college), the credit covers about 10% of the incremental cost. It’s a meaningful annual cash flow benefit, but it doesn’t materially change the order-of-magnitude difference between one-child and two-child household expenditures.
Why does the USDA data define “upper income” at $107,400 when this analysis targets $150k+ households?
The USDA’s three income groups were set in 2015 dollars and divide the two-parent family sample into equal thirds. The upper third was defined as before-tax income above $107,400 in 2015 dollars — which adjusts to approximately $148,000 in 2025 dollars using CPI. That 2025-adjusted threshold very closely aligns with the $150k+ target audience for this analysis. Households significantly above $150k will likely spend more on childcare, private schooling, and discretionary categories than the USDA upper-income average reflects, meaning the figures here represent a reasonable floor rather than a ceiling for high-earning families.
Are 529 plan contributions for two children manageable at $150k income?
At current private university costs of $65,470 per year (College Board, 2025-26), a four-year degree costs approximately $261,880 today. Projecting at a 4% annual tuition inflation rate — consistent with recent College Board data for private nonprofit institutions — a child born today will face a four-year private university cost of roughly $560,000–$580,000 at enrollment. Funding that target from birth requires monthly 529 contributions in the range of $1,400–$1,700 per child, assuming a moderate-growth investment return. Two children effectively double this requirement. The 529 plan contribution strategy from birth provides the full calculation across multiple return assumptions.
Sources & References
- USDA — Families Projected to Spend an Average of $233,610 Raising a Child Born in 2015 (January 9, 2017)
- USDA Center for Nutrition Policy and Promotion — Expenditures on Children by Families, 2015 (Lino et al., revised March 2017)
- College Board — Trends in College Pricing and Student Aid 2025 Highlights
- College Board Newsroom — Trends in College Pricing and Student Aid 2025 Release (November 2025)
- Congressional Research Service — The Child Tax Credit: How It Works and Who Receives It (R41873, 2025)
- IRS — Child Tax Credit (2025)
- Bureau of Labor Statistics — CPI Inflation Calculator
- CalculatorSoup — Inflation Calculator (sourcing BLS CPI-U data)