 Analysis by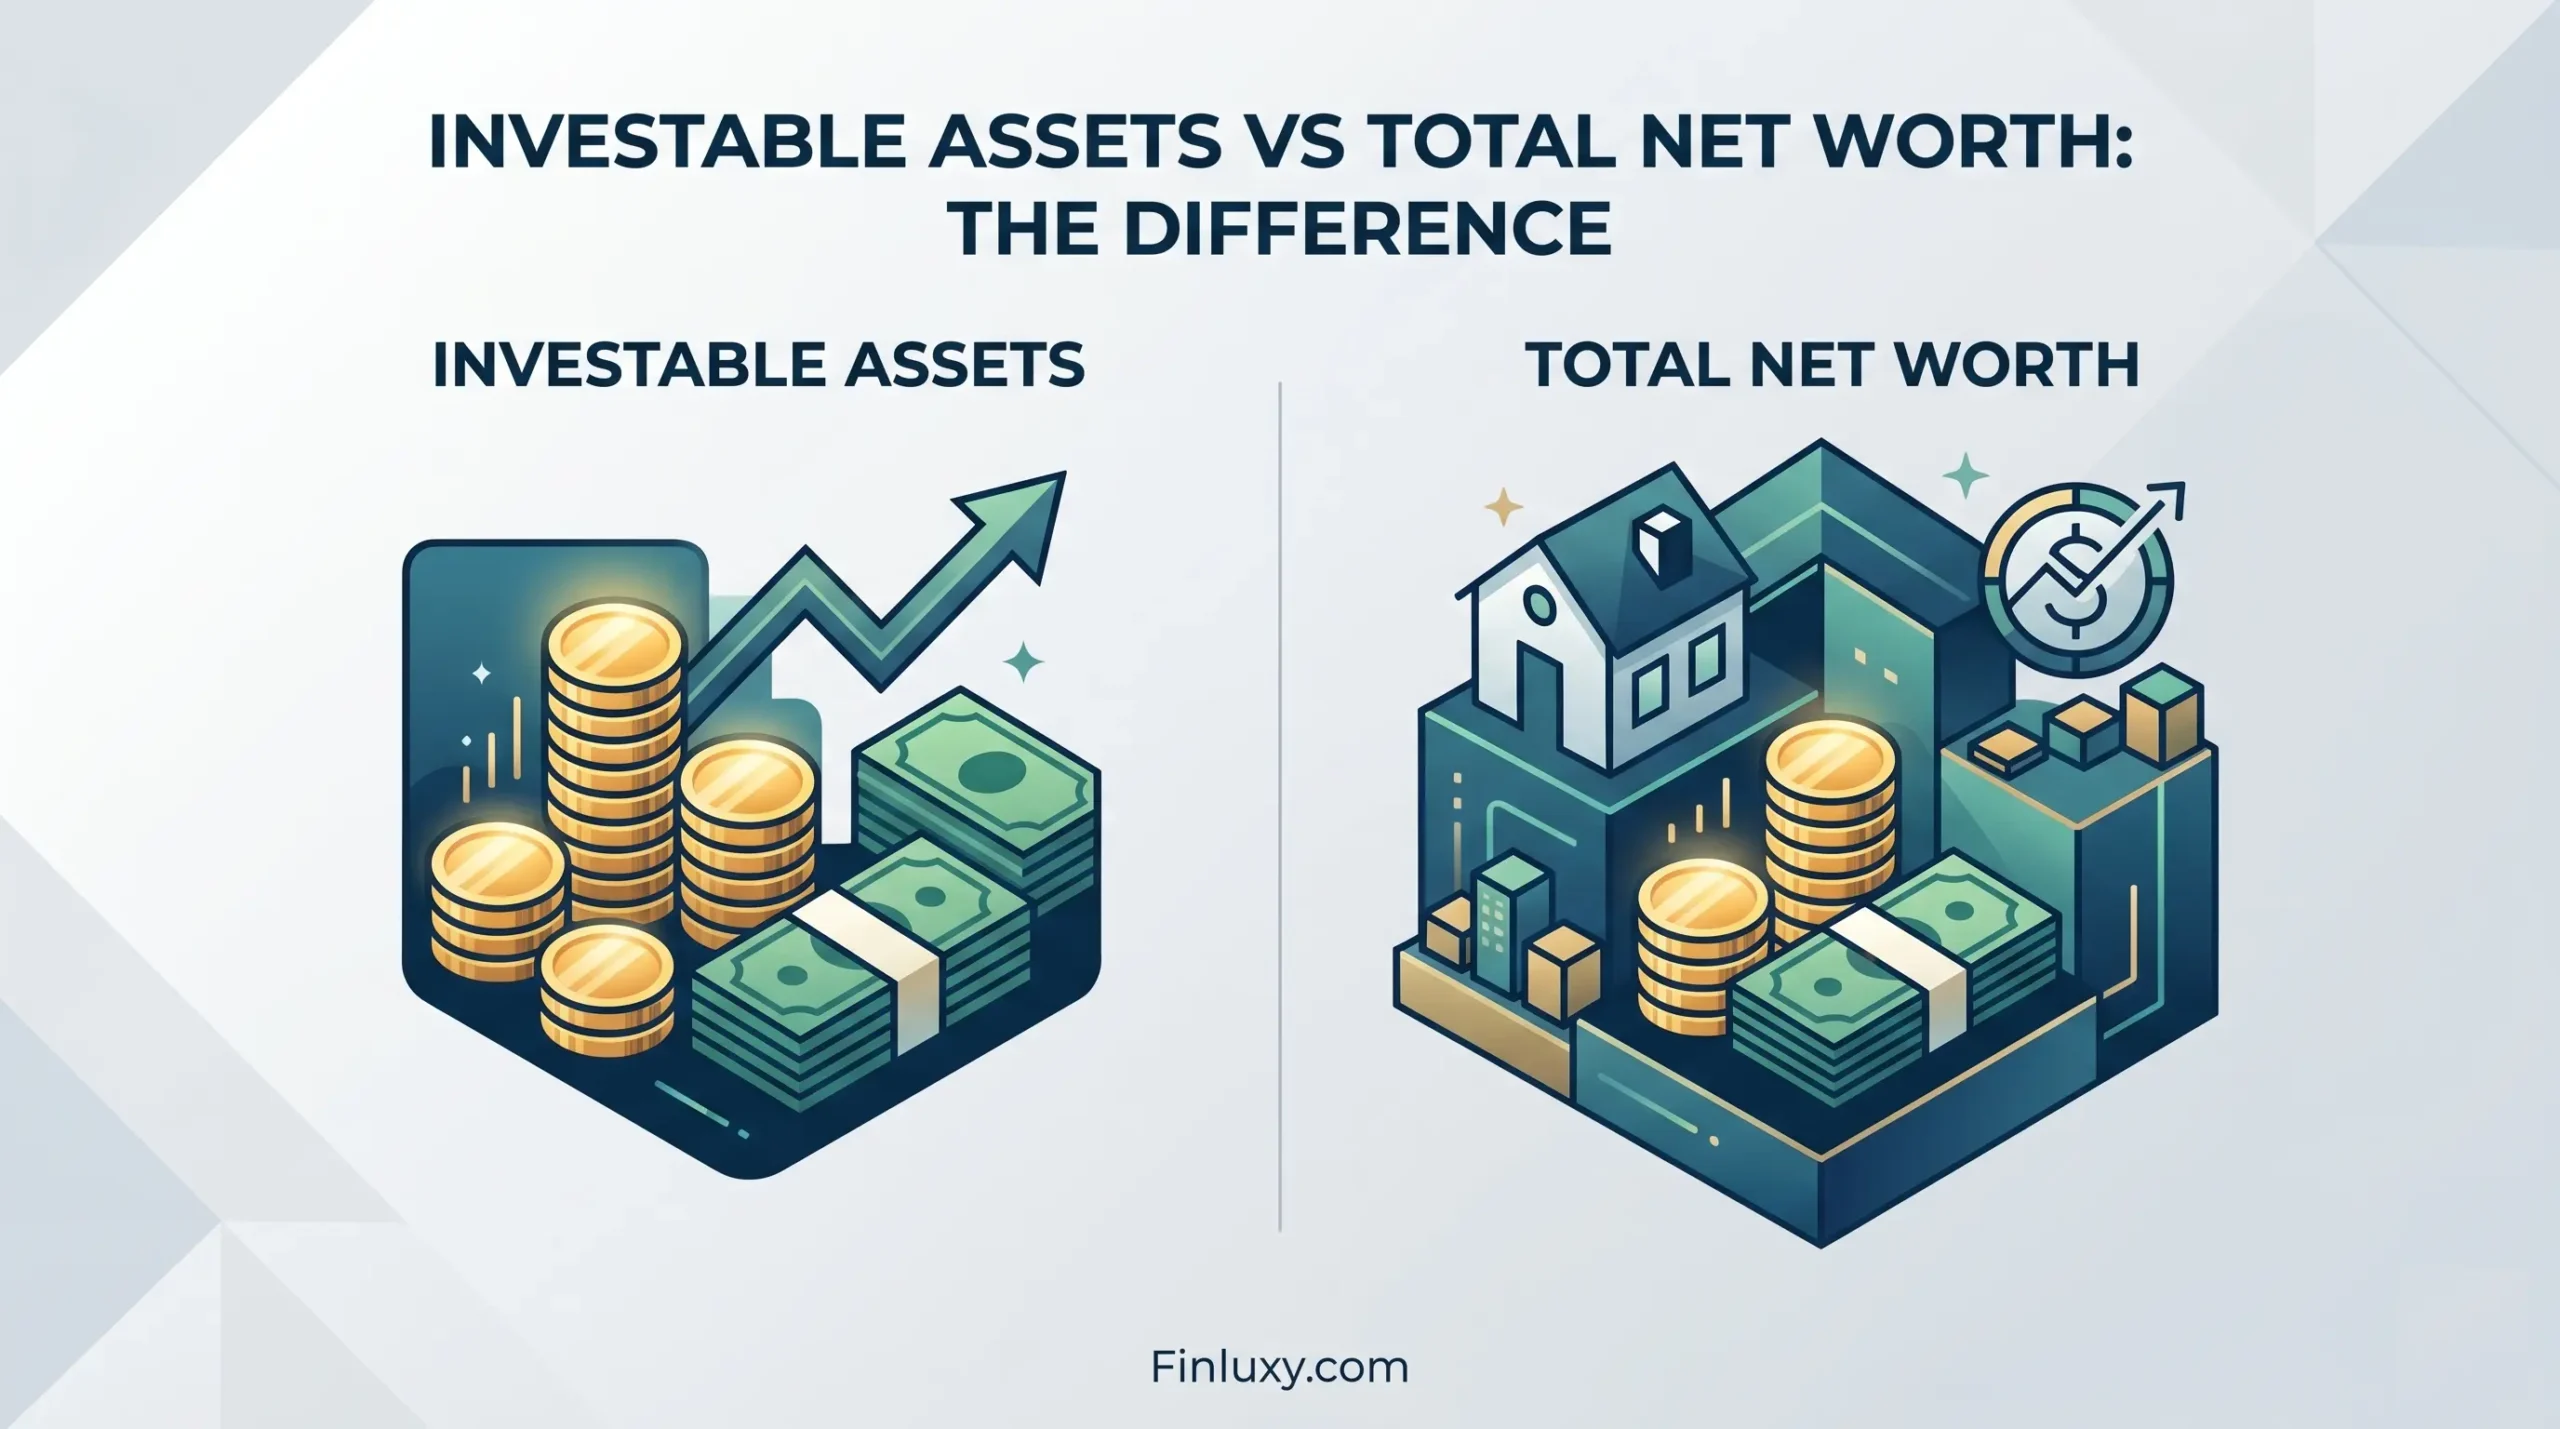
Strip home equity out of the median American household’s $192,700 net worth (SCF 2022) and you’re left with roughly $57,900 in investable assets — a 70% reduction. That gap between total net worth and investable assets is one of the most consequential distinctions in personal finance, and it’s systematically ignored in most wealth benchmarking.
For $150k+ households, the stakes are higher. A household with $900,000 in net worth sounds financially secure until the composition breaks down: $500,000 in home equity, $280,000 in retirement accounts with a decade of lock-up before penalty-free access, and $120,000 in actual liquid, deployable capital. That’s not a $900,000 balance sheet. That’s a $120,000 accessible balance sheet with illiquid promises attached.
This analysis uses household net worth and investable asset data from the Federal Reserve Survey of Consumer Finances (SCF) 2022, released October 2023 — the most recent triennial wealth survey available. All figures are in 2022 dollars unless otherwise noted. Net worth data is not available by specific income band from the SCF’s published bulletin tables; income-stratified percentiles are derived from the SCF 2022 public-use microdata extract, as analyzed and published by CompoundLadder (May 2026). The Finluxy Wealth Accumulation Index calculations in this article use SCF cohort medians as the reference denominator. This article presents data analysis, not financial advice.
Key Figures at a Glance
| Metric | Figure | Source |
|---|---|---|
| Median U.S. household net worth (all ages) | $192,700 | Federal Reserve SCF 2022 |
| Estimated median net worth excluding home equity | ~$57,900 | SCF 2022 microdata analysis |
| Median home equity (homeowners only) | $200,000 | Federal Reserve SCF 2022 Bulletin |
| Share of households with a retirement account | 54.4% | Federal Reserve SCF 2022 |
| Share of households with a brokerage account | 21% | Federal Reserve SCF 2022 |
Sources: Federal Reserve Board, Changes in U.S. Family Finances from 2019 to 2022, October 2023; SCF 2022 microdata analysis via Calculatorian (March 2026).
What the Two Terms Actually Measure
Net worth is total assets minus total liabilities. It includes everything: bank accounts, investment accounts, retirement plans, primary residence, vehicles, business equity, collectibles — offset by mortgages, student loans, car loans, and credit card debt. The SCF uses this definition universally, which is why it’s the right benchmark for comparing household balance sheets across populations.
Investable assets, as used in this analysis, are a subset: liquid and investment accounts excluding the primary home and other illiquid assets. Specifically: cash and bank accounts, taxable brokerage accounts, IRAs, 401(k)s and similar defined contribution plans, and other marketable securities. What’s excluded: primary residence equity, vehicles, business equity, deferred compensation arrangements, and other non-tradeable holdings.
This distinction matters in three concrete ways. First, investable assets are what fund retirement spending — home equity doesn’t generate monthly income unless you sell, downsize, or borrow against it. Second, investable assets are the inputs to portfolio allocation decisions. You can’t rebalance home equity into bonds. Third, investable assets drive savings rate impact on net worth over time — the compounding engine runs on liquid capital, not equity locked in a 4-bedroom house.
The financial advisory industry defines high-net-worth (HNW) status at $1 million in investable assets, explicitly excluding primary residence. The SEC’s accredited investor standard also excludes primary home equity from the $1 million net worth test. These aren’t arbitrary conventions — they reflect a real difference in financial capacity.
The Home Equity Problem
The Federal Reserve’s 2022 SCF Bulletin reports that median home equity for homeowners reached $200,000 in 2022 — up 44% from $139,100 in 2019, the largest three-year gain in the survey’s modern history. For a median household with $192,700 in total net worth, that single figure represents more than the entire reported net worth. The reason it doesn’t consume the whole figure is that many households carry mortgage debt that offsets part of the home value.
Pull that home equity out of the calculation and median net worth across all U.S. households drops to approximately $57,900. That’s the working estimate from SCF 2022 microdata analysis — a 70% collapse from the headline number. The primary residence is, for most American households, the dominant asset. It is also the least liquid, the most expensive to transact, and the only major asset that must be simultaneously replaced if sold.
The implications for $150k+ households are more complex, not simpler. Higher income households tend to own more expensive homes, which means home equity can constitute an even larger raw dollar figure while representing a smaller percentage of total net worth if investable assets are also growing. The 2022 SCF data shows that for top-1% households, home equity represents less than 15% of net worth — largely because financial assets and business equity dominate their balance sheets. The median household’s situation is roughly the inverse.
For a deeper look at whether treating primary residence as a wealth asset makes analytical sense, the primary home in net worth analysis unpacks the practical trade-offs.
What SCF Data Shows by Income Bracket
The SCF 2022 public-use microdata, analyzed by CompoundLadder (May 2026), allows net worth comparison by both age and income bracket simultaneously — a more precise peer comparison than age alone. For households in the $100,000–$200,000 income tier (the lower end of the $150k+ target), the median net worth figures are substantially higher than the all-income medians but still include substantial home equity concentration.
| Age Group | Median Net Worth (All Incomes) | Median Net Worth ($100k–$200k Income) | Difference |
|---|---|---|---|
| Under 35 | $39,000 | $157,000 | +$118,000 |
| 35–44 | $135,600 | $420,000 | +$284,400 |
| 45–54 | $247,200 | $660,000 | +$412,800 |
| 55–64 | $364,270 | $970,000 | +$605,730 |
Sources: Federal Reserve SCF 2022 (all-income medians); CompoundLadder SCF 2022 public-use extract analysis (income-stratified medians), May 2026. All-income median for 35–44 cited per SCF 2022 Bulletin (Federal Reserve, October 2023).
The income premium in net worth is real but not guaranteed. Wealthtender’s analysis of SCF microdata notes that a $150,000-income household at age 40–44 with a $456,000 net worth sits above the median for that income peer group, while a $200,000-income household at the same age at the 25th percentile holds $242,000 — less than the $150k-income median. Earning more accelerates wealth only when the savings rate holds up. Why high income households end up with low net worth documents exactly how this breaks down in practice.
None of these figures tell you how much of that net worth is investable. The SCF does not publish investable-assets-only medians by age and income bracket as a standard table output. The broader Wealthtender analysis of SCF microdata (using DQYDJ methodology) suggests that median investable net worth across the full population peaks at approximately $238,000 for households in their early 70s — roughly half the $439,000 total net worth figure at the same age. That ratio — investable assets at roughly 45–55% of total net worth at the median — likely overstates the investable share for high-income households with expensive primary residences, and understates it for those who have deliberately built liquid portfolios. These are directional estimates, not precise benchmarks. The net worth percentiles by age based on Fed data provide the full distribution context.
Finluxy Wealth Accumulation Index — Applied to Income-Stratified Scenarios
The Finluxy Wealth Accumulation Index measures actual household net worth against the SCF cohort median for that household’s age and income bracket. An index of 1.0 means the household sits exactly at peer median wealth; 2.0 means twice the peer median. The index uses total net worth as reported to the SCF — not investable assets — because that’s what the primary data source measures. Separate tracking of investable asset composition requires the adjustments described throughout this article.
| Scenario | Age | Household Income | Actual Net Worth | SCF Cohort Median (Income-Stratified) | Finluxy Wealth Accumulation Index |
|---|---|---|---|---|---|
| Scenario A: Early accumulator | 38 | $160,000 | $380,000 | $420,000 (ages 35–44, $100k–$200k) | 0.90× |
| Scenario B: Peer median | 38 | $160,000 | $420,000 | $420,000 (ages 35–44, $100k–$200k) | 1.00× |
| Scenario C: Strong accumulator | 50 | $175,000 | $1,200,000 | $660,000 (ages 45–54, $100k–$200k) | 1.82× |
| Scenario D: Pre-retirement, at median | 58 | $180,000 | $970,000 | $970,000 (ages 55–64, $100k–$200k) | 1.00× |
SCF cohort medians: CompoundLadder, SCF 2022 public-use extract analysis, May 2026. Index = Actual Net Worth ÷ SCF Cohort Median Net Worth (income-stratified).
What the index doesn’t capture is the composition of wealth. Scenario C — a 1.82× index — looks strong. But if $800,000 of that $1,200,000 is primary residence equity in a market where the household has no intention of downsizing, the investable base is $400,000, not $1,200,000. The index benchmarks total net worth accumulation. Asset composition is a separate question, and for retirement planning purposes, the more important one. The $1M net worth at 40 analysis works through exactly this tension between headline net worth and retirement-ready capital.
At the peer-median position (1.0× index), a 58-year-old household in the $100k–$200k income bracket holds $970,000 in net worth. If that household follows the approximate all-income investable ratio (investable assets at roughly half of total net worth), the investable base would be roughly $485,000 — well below the $1.5 million threshold that a 4% withdrawal rate requires to sustain $60,000 in annual portfolio income. That’s the retirement math problem hiding inside an index score that looks unremarkable.
Why Total Net Worth Overstates Financial Flexibility
Three structural factors cause total net worth to systematically overstate the financial flexibility of $150k+ households.
The first is home equity concentration. High-income households in coastal and urban markets often carry $400,000–$700,000+ in home equity — a figure that inflates total net worth substantially while contributing nothing to cash flow or portfolio returns. This equity is real wealth in an accounting sense. It just isn’t deployable without a transaction that eliminates or downsizes the asset producing it. The net worth guide for $150k+ households covers the full asset classification framework.
The second factor is retirement account illiquidity. Retirement accounts — 401(k)s, IRAs, defined contribution plans — count toward both total net worth and investable assets, but with a significant constraint: penalty-free access requires age 59½, and Required Minimum Distributions kick in at 73 under current tax law. A 42-year-old with $400,000 in a 401(k) has a real asset, but not one that’s available without a 10% penalty plus ordinary income tax on any early withdrawal. The account’s presence in the net worth figure is accurate; its treatment as fully liquid capital is not.
The third factor is the wealth accumulation efficiency problem that Federal Reserve data documents consistently. Research cited in the SCF 2022 analysis context shows that most households save roughly 10–20 cents of each earned dollar over a lifetime, with high earners frequently saving less per dollar due to lifestyle inflation. A $200,000-income household spending at that rate has a smaller savings ratio than a $75,000 household living significantly below its means. How lifestyle inflation destroys net worth growth puts numbers to this dynamic. Income accelerates wealth accumulation only when the spread between income and spending is preserved and invested.
For a structured comparison of how $150k income households actually build wealth across different time horizons, the wealth accumulation data for $150k income households tracks the trajectory with decade-by-decade breakdowns.
The Overlooked Insight: Retirement Accounts Are Not Fully Liquid Investable Assets
Most wealth analysis treats retirement accounts as investable assets without qualification — and for many purposes, that’s reasonable. But for households in their 30s and 40s, lumping 401(k) balances into the “deployable capital” category creates a distorted picture of financial optionality. The 2022 SCF found that even in the age group with the highest retirement account ownership (45–54), only 62.2% of households hold any retirement account at all. Median retirement account balances for households aged 65–74 were $200,000 — enough to generate approximately $670 in monthly income at a 4% withdrawal rate, according to the Federal Reserve’s own analysis. That is not retirement security for a household accustomed to $150k+ household income.
What most wealth coverage overlooks is the wedge between gross retirement account balance and the after-tax, after-penalty value at various access ages. A traditional 401(k) at age 45 with a $300,000 balance is worth substantially less if accessed early: 10% penalty plus ordinary income tax on withdrawal could reduce a $50,000 distribution to $32,000–$36,000 net, depending on marginal rate. The headline investable asset figure doesn’t reflect this. Sophisticated planning for $150k+ households requires distinguishing between pre-tax retirement accounts (deferred tax liability embedded in the balance), Roth accounts (no future tax liability on qualified distributions), taxable brokerage accounts (capital gains tax treatment), and truly liquid cash positions. These four buckets have materially different after-tax values even at identical pre-tax balances.
Practical Framework: Decomposing Your Household Balance Sheet
A cleaner household balance sheet separates assets into four categories: truly liquid (cash, money market, short-term treasuries); investable and accessible (taxable brokerage accounts, Roth IRAs after age 59½); investable but restricted (traditional 401(k)s, traditional IRAs before 59½, defined contribution plans with vesting schedules); and illiquid (primary residence equity, vehicles, business equity, deferred compensation). Totaling only the first two gives you accessible investable assets. Adding the third gives you total investable assets. Adding the fourth gets you to total net worth.
For a household with $900,000 in total net worth that decomposes as $480,000 in primary residence equity, $320,000 in traditional 401(k), $60,000 in taxable brokerage, and $40,000 in cash: accessible investable assets are $100,000, total investable assets are $420,000, and total net worth is $900,000. The SCF would record $900,000. A retirement income model needs $420,000 — or $100,000 if the household is under 59½ and counting only penalty-free capital.
These distinctions become operationally critical for households approaching decisions about whether to pay off a mortgage, fund additional retirement contributions, or maintain taxable investment accounts. The net worth benchmarks at 35, 45, and 55 offer the age-specific context for where each decomposition typically stands. For profession-specific patterns in how this balance sheet breaks down, wealth by profession comparing doctors, lawyers, and engineers shows that high-income earners in debt-intensive career paths (medicine, law) frequently carry investable assets well below what their income and total net worth would predict.
What This Means for $150k+ Households Specifically
A household earning $200,000 at age 45 sitting at the SCF income-stratified peer median has a total net worth of $660,000. That’s a Finluxy Wealth Accumulation Index of 1.0×. Apply a rough 45–55% investable ratio and the investable asset base is approximately $297,000–$363,000. That range is not enough to retire on without additional years of accumulation, Social Security income, or a meaningful downsize of the primary residence. For comparison, Thomas Stanley and William Danko’s expected net worth formula (age × income ÷ 10, from The Millionaire Next Door, 1996) would peg expected net worth at $900,000 for a 45-year-old earning $200,000 — which positions this household at under two-thirds of the Stanley heuristic threshold. That’s not a failing grade; it’s a warning to not conflate total net worth with retirement readiness.
The specific trade-off for $150k+ earners is between accelerating retirement account contributions (tax-advantaged but illiquid before 59½) and building taxable brokerage positions (taxable but fully accessible). Households with high home equity and heavy retirement account concentration may find themselves net-worth wealthy but cash-flow constrained at exactly the moments when optionality matters: career change, business investment, early retirement consideration. The Millionaire Next Door formula analysis examines whether the Stanley heuristic still holds for modern high-income households, and net worth benchmarks at $100k income by age provide the lower-income reference point for comparison. The $150k+ household that tracks investable assets separately from total net worth — and explicitly manages the composition — is doing something most wealth benchmarking articles don’t push them toward. That separation is where the real financial clarity lives.
Methodology
Primary data source is the Federal Reserve Survey of Consumer Finances (SCF) 2022, released October 2023 — the most recent triennial wealth survey of U.S. households. All-age-group net worth medians are drawn directly from the SCF 2022 Bulletin published by the Federal Reserve Board. Income-stratified net worth percentiles (by age bracket and income tier) are derived from the SCF 2022 public-use microdata extract, as analyzed and published by CompoundLadder (May 2026), which cross-references DQYDJ methodology and the Federal Reserve’s own published Bulletin tables for validation. Home equity figures are sourced from the Federal Reserve Bulletin’s housing wealth supplement (October 2023). The investable-assets-only estimates are directional figures based on SCF microdata analysis by Wealthtender and Calculatorian (both citing SCF 2022 source data) — they represent approximations from microdata modeling, not official published SCF output. The Finluxy Wealth Accumulation Index equals actual household net worth divided by the SCF cohort median net worth for the corresponding income and age bracket. Scenarios in the index table are illustrative composites, not drawn from specific households. The Stanley expected net worth formula is cited as a rough heuristic from Stanley & Danko (1996), The Millionaire Next Door; it is not a precise financial model. Figures are in 2022 dollars throughout.
Frequently Asked Questions
Does home equity count as an investable asset?
No, under the standard definition used in wealth management and financial planning. Investable assets are liquid and investment holdings — retirement accounts, brokerage accounts, cash — that can be allocated to markets or drawn down without requiring a property transaction. Home equity is included in total net worth but excluded from investable assets, which is why the SEC’s accredited investor net worth test also excludes primary residence equity.
Why do retirement accounts appear in both net worth and investable assets?
Retirement accounts — 401(k)s, IRAs, Roth accounts — are financial assets, so they count in both figures. The nuance is access timing. Before age 59½, traditional retirement accounts carry a 10% early withdrawal penalty plus ordinary income tax on distributions, making them substantially less valuable than a face-value figure suggests. Sophisticated balance sheet analysis distinguishes between accessible investable assets (penalty-free capital) and total investable assets (including locked retirement accounts), particularly for households in their 30s and 40s.
What does the SCF say about net worth for $150k–$200k income households specifically?
The SCF 2022 public-use microdata, analyzed by CompoundLadder (May 2026), shows that households in the $100,000–$200,000 income bracket have median net worth of approximately $157,000 (under 35), $420,000 (ages 35–44), $660,000 (ages 45–54), and $970,000 (ages 55–64). These are total net worth figures including home equity. The SCF does not publish investable-assets-only medians by income and age as a standard output.
Is a Finluxy Wealth Accumulation Index above 1.0× actually a good position?
Being above 1.0× means the household holds more total net worth than the median peer in the same age and income bracket — a better starting point than most. Whether it constitutes a “good” position depends entirely on asset composition and retirement income goals. A 1.2× index dominated by home equity and tax-deferred retirement accounts in a household 20 years from retirement is structurally different from a 1.2× index with substantial taxable brokerage holdings. The index benchmarks accumulation; it doesn’t evaluate composition or sufficiency.
How should a $150k+ household track the difference between total net worth and investable assets?
Separate the balance sheet into four buckets: truly liquid assets (cash, money market); accessible investable assets (taxable brokerage, Roth accounts after 59½); restricted investable assets (traditional 401(k)s, traditional IRAs before 59½); and illiquid assets (primary residence equity, vehicles, business equity). Tracking net worth across all four buckets monthly, while specifically monitoring the accessible and restricted investable totals, gives a more operationally useful picture than a single net worth figure. The gap between total net worth and accessible investable capital is the number that determines real financial optionality at any given age.
Sources & References
- Federal Reserve Board — Changes in U.S. Family Finances from 2019 to 2022 (SCF 2022 Bulletin), October 2023
- Federal Reserve Board — Survey of Consumer Finances (SCF) data and documentation
- CompoundLadder — Net Worth Percentile Table by Age and Income, SCF 2022 public-use extract analysis, May 2026
- DQYDJ — United States Net Worth Brackets, Percentiles, and Top One Percent (SCF 2022)
- Wealthtender — Net Worth by Age Including Investable Net Worth Excluding Home Equity (SCF 2022 microdata analysis)
- Calculatorian — Net Worth by Age: Median and Average from Federal Reserve Data (SCF 2022), March 2026
- U.S. Census Bureau — Median Home Equity Rose by $47,900 From 2019 to 2022 (SIPP data), December 2024
- LegalClarity — High Net Worth Definition: Tiers, Thresholds, and SEC Accredited Investor Standard
- WorthIt — Net Worth Percentile by Income and Age, SCF 2022 with CPI adjustment, March 2026