 Analysis by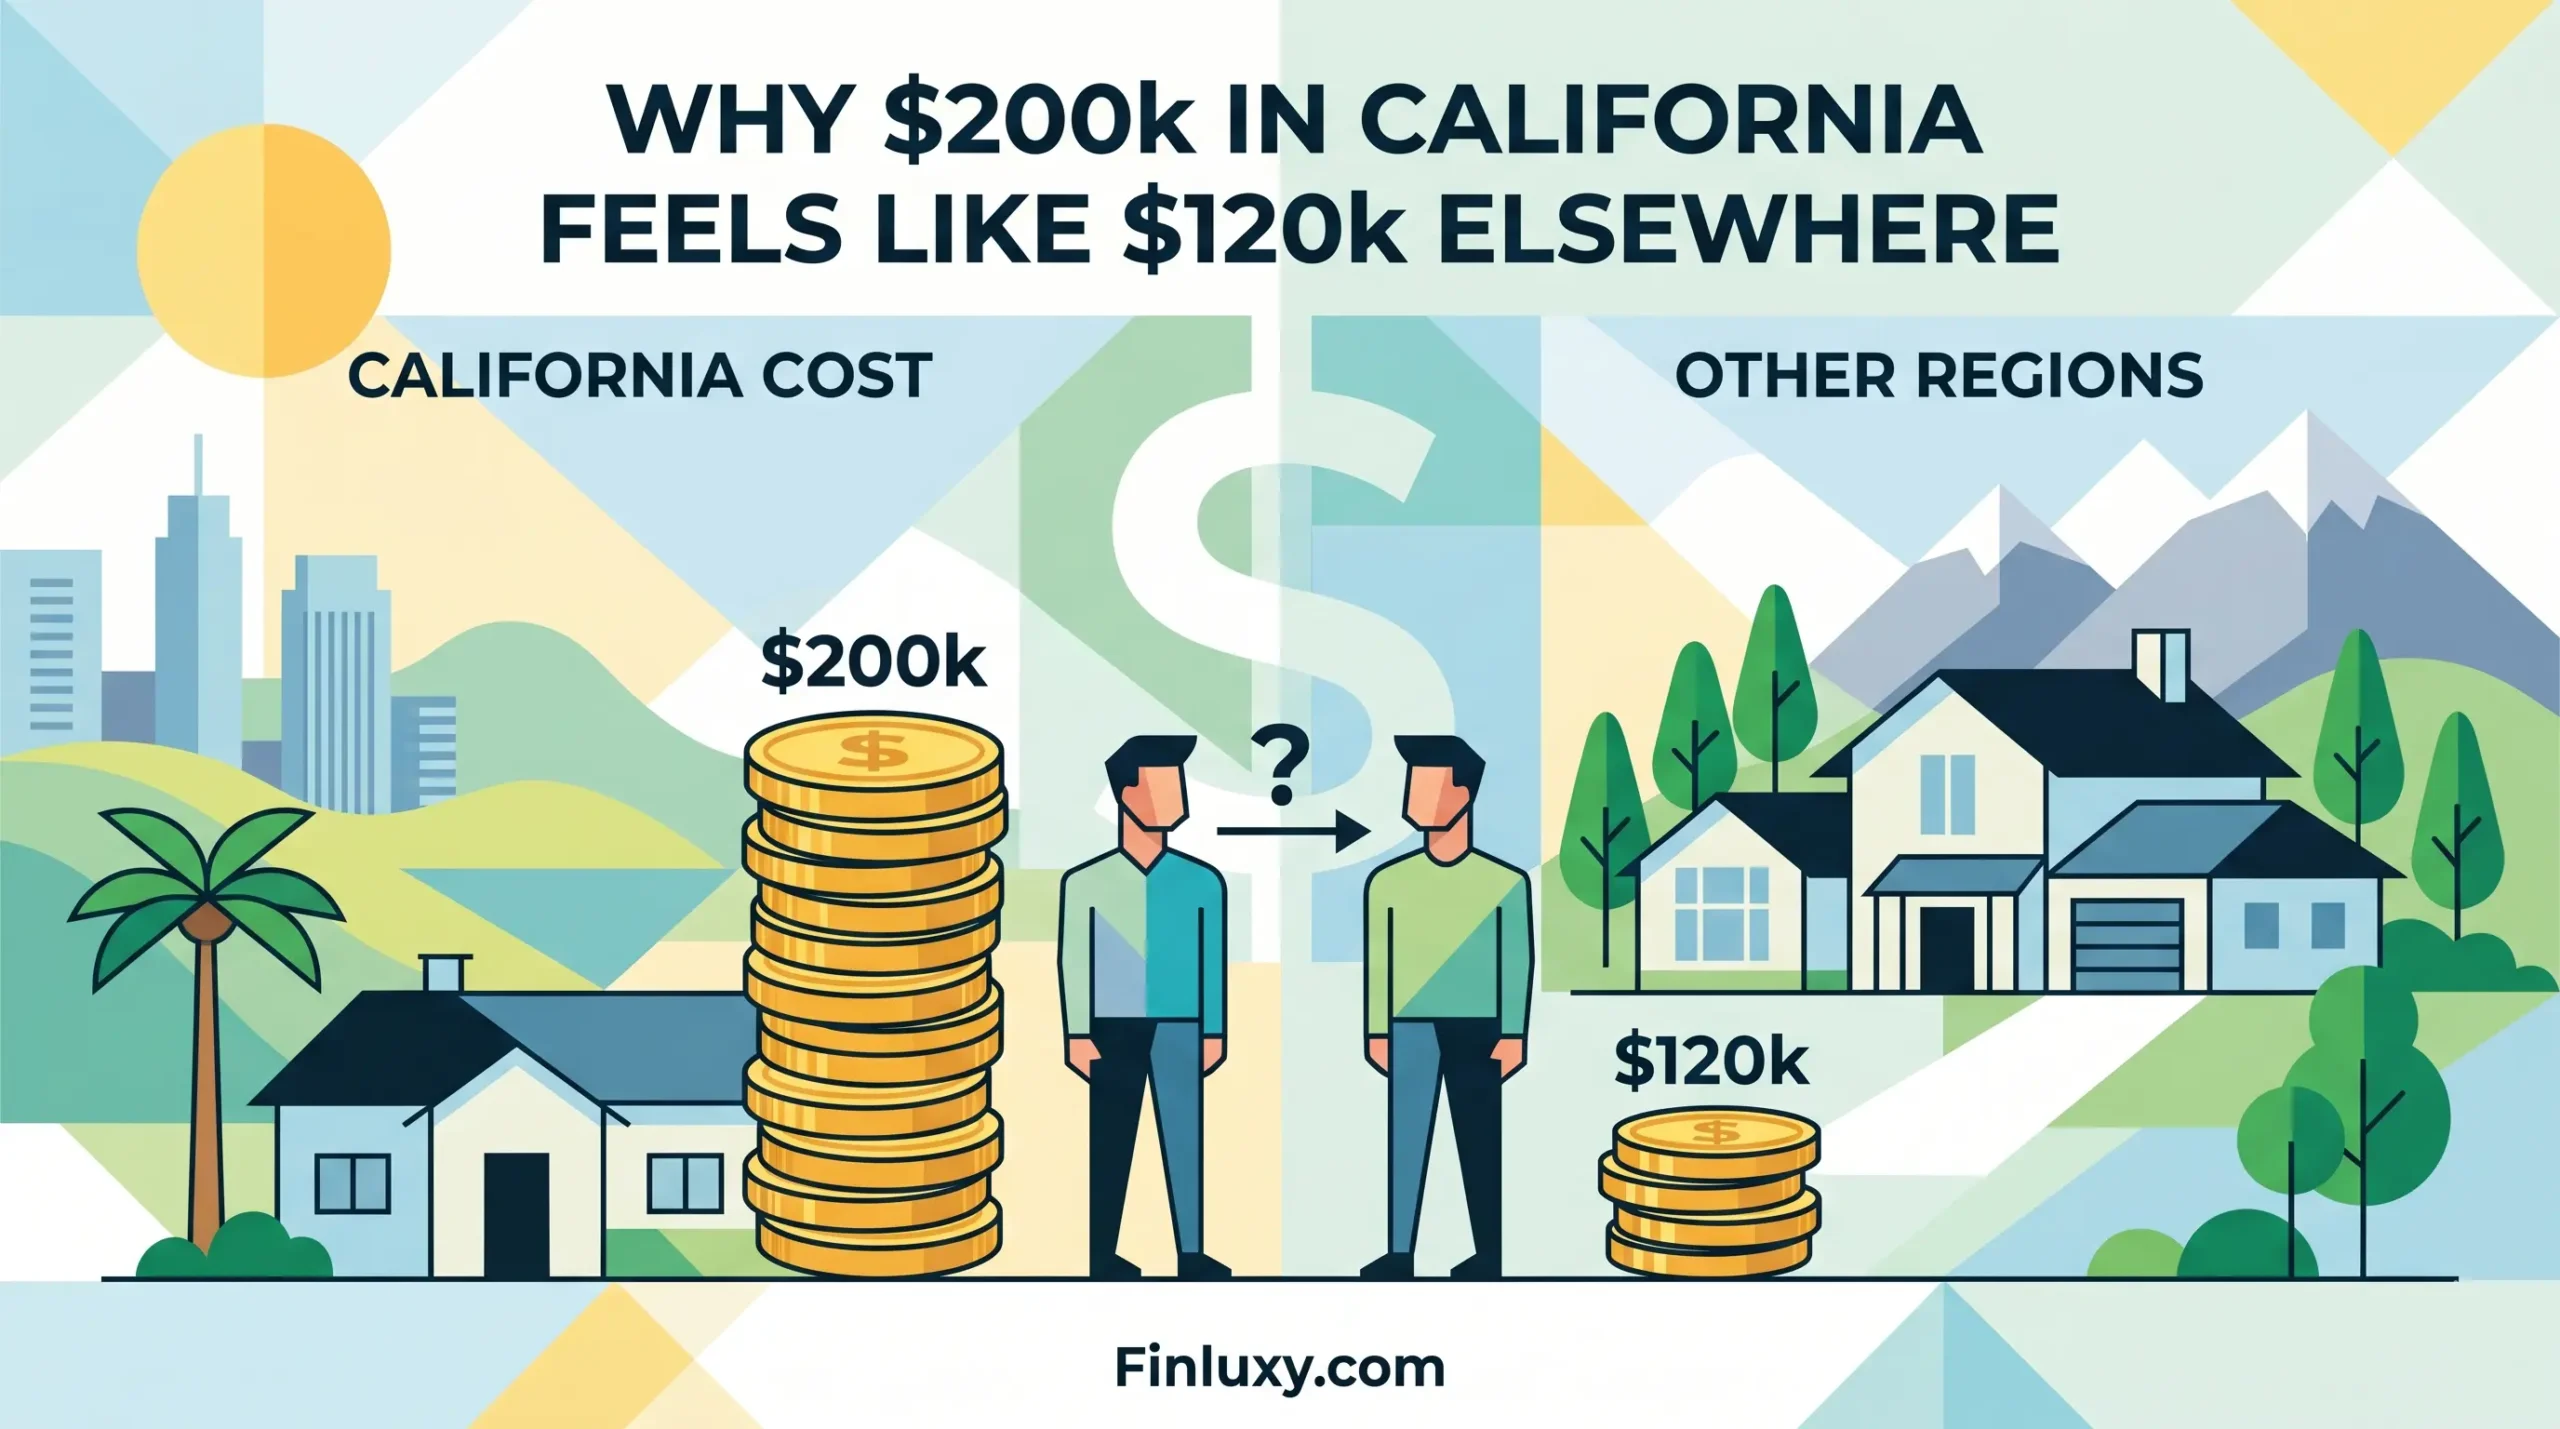
A $200k salary generates $131,694 in after-tax income in California. The same salary in Texas produces $148,935. That $17,241 annual gap — before housing enters the picture — is the tax floor of the California discount. Once you add San Francisco rent, the monthly difference in actual disposable income between a San Francisco earner and a Dallas earner balloons to over $3,000 per month on the same gross salary.
This article runs the full gross-to-disposable waterfall for a single filer earning $200k: federal income tax, California state income tax, FICA, California SDI, housing, transportation, and food — using 2025 tax schedules and 2024 BLS Consumer Expenditure Survey data by income bracket. The result is a specific Finluxy Real Disposable Income Rate for each city, not a vague claim that California is expensive.
Scope and limitations: All tax calculations use 2025 IRS and California FTB schedules for a single filer taking the standard deduction, with W-2 wage income only. No pre-tax retirement contributions, no itemized deductions, no investment income. Spending figures come from the BLS Consumer Expenditure Survey 2024 release for the $200,000-and-above income bracket — a national average that does not capture city-level variation in food and transportation costs. Housing figures are drawn from Zillow and Redfin rental market data for mid-to-late 2025. Married couples will see substantially different federal and California tax outcomes; the methodology section describes how to adapt the framework. This is a data analysis, not tax advice.
Key Numbers at a Glance
| Metric | California (San Francisco) | Texas (Dallas) |
|---|---|---|
| Gross income | $200,000 | $200,000 |
| Total taxes (federal + state + FICA + SDI) | $68,306 | $51,065 |
| Annual net income | $131,694 | $148,935 |
| Monthly net income | $10,975 | $12,411 |
| Median rent (2025) | ~$3,500/mo (SF) | $1,895/mo (Dallas) |
| Monthly disposable income (after housing, food, transportation) | $3,576 | $6,617 |
| Finluxy Real Disposable Income Rate | 21.5% | 39.7% |
Sources: IRS Revenue Procedure 2024-40 (federal brackets); California FTB 2025 Tax Rate Schedule X (state brackets); California EDD (SDI rate 1.2%, 2025); BLS Consumer Expenditure Survey 2024 via FRED (spending by income bracket); Zillow/Redfin rental market data, mid-to-late 2025.
The Tax Gap Is the Foundation, Not the Punchline
Most coverage of the California income problem leads with anecdotes and ends with housing. The tax arithmetic deserves more precision. For a single filer earning $200k in 2025 with W-2 wages and no itemized deductions, the gross-to-net waterfall breaks down as follows.
Federal income tax on $185,000 of taxable income (after the $15,000 standard deduction, per IRS Revenue Procedure 2024-40) works out to $37,247 — an effective federal rate of 18.6%. FICA adds $13,818: Social Security at 6.2% on the first $176,100 of wages plus Medicare at 1.45% on all wages. These figures are identical whether you live in California or Texas.
California diverges sharply at the state level. The California Franchise Tax Board’s 2025 Schedule X applies to single filers, and its standard deduction is only $5,706 — nearly $9,300 less than the federal standard deduction. That narrow deduction leaves $194,294 of California taxable income, pushing the marginal rate to 9.3% on the bulk of earnings between $72,724 and $371,479. Total California state income tax: approximately $14,841, an effective state rate of 7.4% on gross income. California also levies State Disability Insurance through its Employment Development Department at 1.2% on all wages with no wage ceiling, adding another $2,400 to the bill.
Texas has no state income tax and no SDI equivalent. The tax gap between the two states for this earner is $17,241 per year — before a single dollar of rent or groceries is spent. That figure represents the minimum disadvantage California imposes purely through its tax structure, and it accrues automatically regardless of lifestyle choices.
| Tax Component | California | Texas |
|---|---|---|
| Federal income tax (IRS Rev. Proc. 2024-40) | $37,247 | $37,247 |
| FICA (Social Security + Medicare) | $13,818 | $13,818 |
| California state income tax (FTB Schedule X, 2025) | $14,841 | $0 |
| California SDI (EDD, 1.2%, 2025) | $2,400 | $0 |
| Total taxes | $68,306 | $51,065 |
| Annual net income | $131,694 | $148,935 |
| Effective total tax rate | 34.2% | 25.5% |
Sources: IRS Revenue Procedure 2024-40; California FTB 2025 Tax Rate Schedules (ftb.ca.gov); California EDD Contribution Rates 2025 (edd.ca.gov).
Housing Doubles the Damage
The $17,241 annual tax penalty is only the beginning. Layer in housing costs after taxes at $200k and the picture deteriorates much faster.
Zillow and Redfin both track San Francisco rental market data continuously. The Zillow median rent for all property types in San Francisco was $3,285 in mid-2024, and Redfin’s data showed an average of $3,724 in August 2025. Using a representative 2025 figure of approximately $3,500 per month — squarely in the middle of that range — a San Francisco renter on $200k spends $42,000 per year on housing alone. That’s 32% of gross income and 38% of after-tax income, a ratio that meets the textbook definition of housing cost burden even at this salary level.
Dallas looks entirely different. Zillow’s rental market data put Dallas at $1,895 per month as of 2025. At $22,740 per year, the Dallas renter is spending $19,260 less on housing annually than the San Francisco renter — on the same gross income. Stacked on top of the $17,241 tax disadvantage, the California earner is now $36,501 behind before transportation or food enters the budget.
This is the COL-adjusted income gap by city that matters most. The numbers aren’t about whether San Francisco has nicer weather or better restaurants. They’re about what the same salary actually purchases once the mandatory fixed costs clear.
Finluxy Real Disposable Income Rate: San Francisco vs. Dallas
The Finluxy Real Disposable Income Rate quantifies what fraction of gross monthly income remains as discretionary income after the four largest cost categories: taxes, housing, transportation, and food. It expresses purchasing power as a percentage — higher is better.
Spending figures for the $200,000-and-above income bracket come directly from the BLS Consumer Expenditure Survey 2024 (December 2025 release, accessed via FRED). Households in this bracket spent $28,335 annually on transportation ($2,361/month) and $18,453 on food ($1,538/month). These are national averages; city-level variation exists, particularly in transportation costs where San Francisco’s public transit infrastructure typically reduces car ownership rates relative to Dallas. The BLS does not publish city-level data segmented by income bracket at this resolution, so this framework uses the national figure as a conservative baseline and notes where city-specific context would shift the outcome.
| Component | San Francisco (CA) | Dallas (TX) |
|---|---|---|
| Gross monthly income | $16,667 | $16,667 |
| Monthly net income (after taxes) | $10,975 | $12,411 |
| Housing (monthly) | $3,500 | $1,895 |
| Transportation (BLS CE 2024, $200k+ bracket) | $2,361 | $2,361 |
| Food (BLS CE 2024, $200k+ bracket) | $1,538 | $1,538 |
| Monthly disposable income | $3,576 | $6,617 |
| Finluxy Real Disposable Income Rate | 21.5% | 39.7% |
Sources: Tax figures from IRS and California FTB/EDD (2025); Housing from Zillow/Redfin rental market data (2025); Transportation and food from BLS Consumer Expenditure Survey 2024, $200,000+ bracket via FRED (December 2025 release).
The 18.2 percentage-point spread in the Finluxy Real Disposable Income Rate — 39.7% in Dallas versus 21.5% in San Francisco — is not primarily a housing story. Of the $3,041 monthly gap in disposable income between the two cities, $1,436 comes from the housing difference and $1,436 comes from the tax difference. They contribute almost equally. The narrative that “California taxes aren’t that bad” ignores that the tax gap alone accounts for roughly half of the lifestyle-purchasing-power difference.
What $200k Feels Like Across California’s Major Markets
San Francisco represents the most extreme California scenario, but it’s not the only one. Los Angeles, San Diego, and San Jose each carry their own housing cost premium — while sharing the same California tax burden. The tax waterfall is identical statewide; only the housing cost changes.
| City | Median Rent (All Bedroom Types, 2025) | Monthly Net After Taxes | Remaining After Rent | Rent as % of Net |
|---|---|---|---|---|
| San Francisco | ~$3,500 | $10,975 | $7,475 | 31.9% |
| San Jose | ~$3,000 | $10,975 | $7,975 | 27.3% |
| Los Angeles | $2,675 | $10,975 | $8,300 | 24.4% |
| San Diego | $3,005 | $10,975 | $7,970 | 27.4% |
Sources: Zillow Rental Manager market trends data (2025); California FTB 2025 Schedule X and IRS Rev. Proc. 2024-40 for net income calculation. San Jose rent is an estimated range based on available market data; San Francisco and LA figures from Zillow.
Los Angeles at $2,675/month median rent (Zillow, 2025) is the most accessible major California market in this comparison — but still leaves the $200k earner paying 24.4% of net income on rent alone. In Dallas, the same 24.4% applied to net income would equate to about $3,028 per month in rent — 60% more than the Dallas median of $1,895. The California earner in Los Angeles still has the same tax disadvantage: $17,241 per year less than their Texas counterpart, before lifestyle spending begins.
For the Finluxy reader comparing $100k after tax across NYC, Dallas, and Miami, the same dynamic applies at higher salary levels, only the housing premium compounds more aggressively as you move up-market in California’s coastal cities.
The Overlooked Insight: California’s SDI Is Now an Uncapped Tax on High Earners
Most cost-of-California analysis focuses on state income tax — the 9.3% marginal rate on income between $72,724 and $371,479. That’s fair. But California’s State Disability Insurance rate quietly became a more significant burden for high earners starting in 2024, when Senate Bill 951 permanently removed the wage ceiling on SDI contributions. Before 2024, SDI had a taxable wage cap; above that cap, no additional SDI was owed. Now the rate applies to every dollar of wages, no limit.
For a $200k earner, the 2025 SDI rate of 1.2% (confirmed by the California EDD) generates a $2,400 annual charge — roughly the cost of a month’s groceries at the spending levels typical for this income bracket. For a $500k earner, that same 1.2% rate produces a $6,000 SDI bill. At $1 million in wages, the charge is $12,000 per year — an amount most Californians have no idea they’re paying, because it blends into paycheck line items that rarely receive scrutiny. The SDI rate has increased from 0.9% in 2023 to 1.1% in 2024 to 1.2% in 2025, per EDD historical data, while the cap removal amplifies the dollar impact at every income level above the old ceiling. This is the piece that standard “$200k in California” analyses consistently undercount.
Understanding why six figures still leaves earners financially stretched requires accounting for all the payroll line items, not just the marginal income tax rate.
The Real Disposable Income Curve: What $200k Buys at Different Lifestyle Levels
Discretionary income — the money available for flexible spending and saving after fixed costs clear — is the true measure of what a salary delivers. For the California earner, the $3,576 monthly disposable figure above assumes renting at median market rate and spending at the national BLS average for their income bracket. But lifestyle inflation — the tendency to increase spending as income grows, particularly in high-cost cities where premium goods and services are more visible and socially normalized — can compress this figure further.
A San Francisco earner who upgrades to a two-bedroom apartment at $4,700/month (Zumper’s 2025 two-bedroom median for San Francisco) sees monthly disposable income fall to $2,376 — a Finluxy Real Disposable Income Rate of just 14.3%. A Dallas earner in the same two-bedroom configuration at approximately $2,200/month would still clear $6,312 monthly in disposable income — a rate of 37.9%.
This is the arithmetic behind the “$200k doesn’t feel wealthy in California” perception. The feeling is accurate. The data confirms it. The BLS Consumer Expenditure Survey 2024 shows households earning $200k or more nationally spend an average of $49,733 per year on housing — already 24.9% of gross income — and that figure reflects national averages that are weighted downward by lower-cost markets. In San Francisco, where the Zillow median rent already runs 85% higher than the national BLS average for this bracket, the compression is severe.
For a deeper dive into the same dynamics at lower income levels, the $150k income budget in San Francisco shows how a lower starting salary interacts with the same fixed-cost structure — and the Finluxy Real Disposable Income Rate at that level is considerably worse.
What This Means for $150k+ Households Making Location Decisions
For households in the Finluxy reader segment — $150k+ income, financially sophisticated, evaluating high-cost versus lower-cost markets — the $200k California case produces a specific decision framework. The question isn’t whether California is expensive. The question is what the cost buys and whether competing markets offer equivalent value.
The $17,241 annual tax advantage of Texas is fixed and compounding. Invested at 7% annually over 10 years, that differential represents roughly $238,000 in additional wealth accumulation — before housing savings are layered in. The wealth accumulation gap at $150k vs. $300k over a decade is heavily influenced by exactly this kind of structural cost difference. California’s advantages — labor markets, equity compensation culture, career networks in specific industries — need to clear a high hurdle to offset the tax and housing cost burden on a pure financial basis.
The calculation also changes significantly for dual-income couples. Married filing jointly in California at $400k combined would face 9.3% marginal state tax on the combined income between $145,448 and $742,958 (FTB Schedule Y, 2025), with the same uncapped SDI applying to both earners. The household-level Finluxy Real Disposable Income Rate for a dual-income couple in San Francisco on $400k combined would fall in the 22–27% range depending on housing configuration — still higher than a single earner, but still dramatically below what the same gross generates in a zero-income-tax state.
The data on six-figure income reality consistently shows that the geography of income matters as much as the headline salary. A $200k earner choosing between San Francisco and Dallas isn’t choosing between equal lifestyles at different addresses. The Finluxy Real Disposable Income Rate captures the gap precisely: 21.5% versus 39.7% of gross income available after mandatory costs. That 18-point spread is the financial definition of why $200k in California feels like $120k elsewhere — and the math is specific enough to hold up to scrutiny.
For $150k+ households evaluating whether a California premium role justifies the cost, the threshold question is whether the compensation differential between a California offer and a comparable Texas or other no-income-tax-state offer exceeds $17,241 in annual salary — just to break even on taxes alone. For most professional roles outside of California-specific industries, that premium is rarely offered and rarely documented in compensation negotiation, which is one reason the gap persists without being corrected by the market. Understanding the $150k household budget breakdown alongside this analysis gives households the full cost picture before making a location decision.
Frequently Asked Questions
Does California’s higher salary average offset the tax burden?
Partially, in specific industries. California’s technology and entertainment sectors do pay above-market compensation relative to national benchmarks, and the equity compensation culture in Silicon Valley can produce income that no other market replicates. But the tax and housing cost differential is structural — it applies to every dollar of W-2 income regardless of industry. A $200k earner in a field where California pays no salary premium over Texas or Florida faces the full $17,241+ annual tax disadvantage with no offsetting income benefit. Households should calculate the California premium their specific role commands, compare it to the verified tax gap, and then factor in housing — not assume the premium exists.
How does the comparison change for married couples?
Significantly. Married couples filing jointly face different California bracket thresholds (Schedule Y, FTB 2025) and a higher federal standard deduction ($30,000 for 2025, per IRS Rev. Proc. 2024-40). On a combined $200k household income with two earners, the federal tax burden is lower due to bracket compression effects, but California state tax and SDI still apply to both earners’ wages independently. The housing cost advantage of Texas and other low-tax states scales with household income — two earners paying SDI on $400k combined wages owe $4,800 to California EDD annually with no ceiling, versus $0 in Texas.
What if I own instead of rent in California?
Homeownership in California introduces Proposition 13 property tax limitations (assessed value locked at purchase price with a maximum 2% annual increase), which can create significant long-term tax advantages for those who bought before recent price spikes. However, entry costs at current San Francisco and Los Angeles price levels are prohibitive for most $200k earners: a 20% down payment on the San Francisco median home price requires $200,000–$250,000 in cash, and mortgage payments on the remaining balance at current rates would exceed the $3,500/month rental figure used here. Homeownership may improve the long-run math; it worsens the near-term cash flow situation for buyers entering today’s California market. The $200k salary budget reality covers the ownership path in more detail.
Are remote workers in lower-cost states actually saving this much?
For remote workers who have established domicile in a zero-income-tax state and work for employers outside California, yes — the full tax gap applies. California’s Franchise Tax Board does not tax wages earned entirely outside the state by nonresidents. However, remote workers who maintain California residence while working remotely still owe California income tax and SDI on all wages. The domicile distinction matters legally and financially; workers who relocated during 2020–2022 and haven’t updated their legal residence documentation may still be filing as California residents. The tax savings are real but require actual, documented change of domicile — not just physical presence elsewhere.
Methodology
Tax calculations use the 2025 IRS federal income tax brackets from Revenue Procedure 2024-40 and the 2025 California Franchise Tax Board Tax Rate Schedule X for single filers, both retrieved directly from official agency sources. The California standard deduction of $5,706 is from the FTB 2025 publication. The California SDI rate of 1.2% with no wage ceiling is from the California EDD Contribution Rates page and the EDD household employer guide (DE 8829, January 2025). FICA calculations use the 2025 Social Security wage base of $176,100 (IRS guidance) and standard rates of 6.2% (SS) and 1.45% (Medicare).
Spending data for the $200,000-and-above income bracket — housing ($49,733), transportation ($28,335), and food ($18,453) annually — are drawn from the BLS Consumer Expenditure Survey 2024 release (December 19, 2025) accessed via FRED series CXUHOUSINGLB0223M, CXUTRANSLB0223M, and CXUFOODTOTLLB0223M. These figures represent national averages for this income bracket; they do not capture city-level variation in spending patterns.
Rental market data for San Francisco uses the range bracketed by Zillow Rental Manager (median $3,285, mid-2024 data) and Redfin rental market trends ($3,724 average, August 2025), with $3,500/month used as a representative 2025 midpoint. Dallas figures use the Zillow Rental Manager median of $1,895 and the Zumper/CultureMap-reported Zillow figure of $1,785–$1,895 for 2025. Los Angeles and San Diego rent figures are from Zillow Rental Manager’s national comparison tool.
The Finluxy Real Disposable Income Rate is calculated as: (monthly net income − monthly housing − monthly transportation − monthly food) ÷ gross monthly income × 100. Transportation and food use the national BLS bracket averages for consistency across cities; location-specific adjustments would require city-level CE data that BLS does not publish at this income bracket resolution.
Sources & References
- IRS Revenue Procedure 2024-40 — 2025 federal tax brackets, standard deduction, FICA wage base
- California FTB 2025 Tax Rate Schedules — Schedule X (single), Schedule Y (married filing jointly)
- California EDD — 2025 SDI contribution rate (1.2%), benefit amounts
- FRED/BLS Consumer Expenditure Survey 2024 — Housing expenditures, $200k+ income bracket
- FRED/BLS Consumer Expenditure Survey 2024 — Transportation expenditures, $200k+ income bracket
- FRED/BLS Consumer Expenditure Survey 2024 — Food expenditures, $200k+ income bracket
- BLS Consumer Expenditures 2024 — Annual news release (December 19, 2025)
- Zillow Rental Manager — Market trend data for San Francisco, Dallas, Los Angeles, San Diego (2025)
- Redfin — San Francisco rental market trends (August 2025)
- Tax Foundation — 2025 federal income tax brackets and rates