Skip to content
Finluxy
Finluxy
  • Affluent Living
  • Income Reality
  • Life & Money
  • Luxury Spending
  • Real Estate
  • Smart Spending
  • Tax & Wealth

Six-Figure Life

Six figures sounds like a lot — and for much of the country, it is. But the experience of earning $100,000, $150,000, or $250,000 varies so dramatically by geography, family structure, and tax burden that the same gross income can produce entirely different financial realities. Understanding what your income actually produces in your specific context is more useful than any national benchmark.

$100,000 in gross household income in Tulsa, Oklahoma — after federal and state tax, with a modest mortgage — can support a comfortable middle-class lifestyle with real savings capacity. The same $100,000 in San Francisco after California income tax (approximately $15,000 in state tax alone), a Bay Area rent of $3,500–$5,000 per month for a one-bedroom, and above-average costs across food, transportation, and services leaves minimal room for savings and would put a household at genuine financial stress by most planning standards. The geography variable alone shifts the effective quality of life by several income brackets.

The $200,000–$300,000 household income range is where six-figure life begins to feel meaningfully comfortable in most major markets — and where the illusion of wealth can develop alongside surprisingly limited actual savings. A dual-income household earning $250,000 in New York City with two children in private school, a mortgage, and active lifestyle spending can have a savings rate of 5–10% or less, which is objectively underpowered for long-term wealth building at that income level. The spending context that explains this is covered across the Luxury Spending and Affluent Living pillars.

For a precise calculation of what any income level produces after taxes in a specific state, see take-home pay. And for how dual-income households experience the six-figure life differently than single-income households at the same combined total, see dual income. The Income Reality pillar provides the full context for understanding what different compensation levels mean in practice.


Geometric illustration of a professional couple surrounded by icons of a house, car, travel gear, and savings bags.

Six-Figure Income Reality: What $150k Actually Buys

Geometric vector illustration of a person holding up a glass ceiling containing lifestyle symbols beneath a skyline background.

The $100k Ceiling: Why Lifestyle Doesn’t Scale With Income

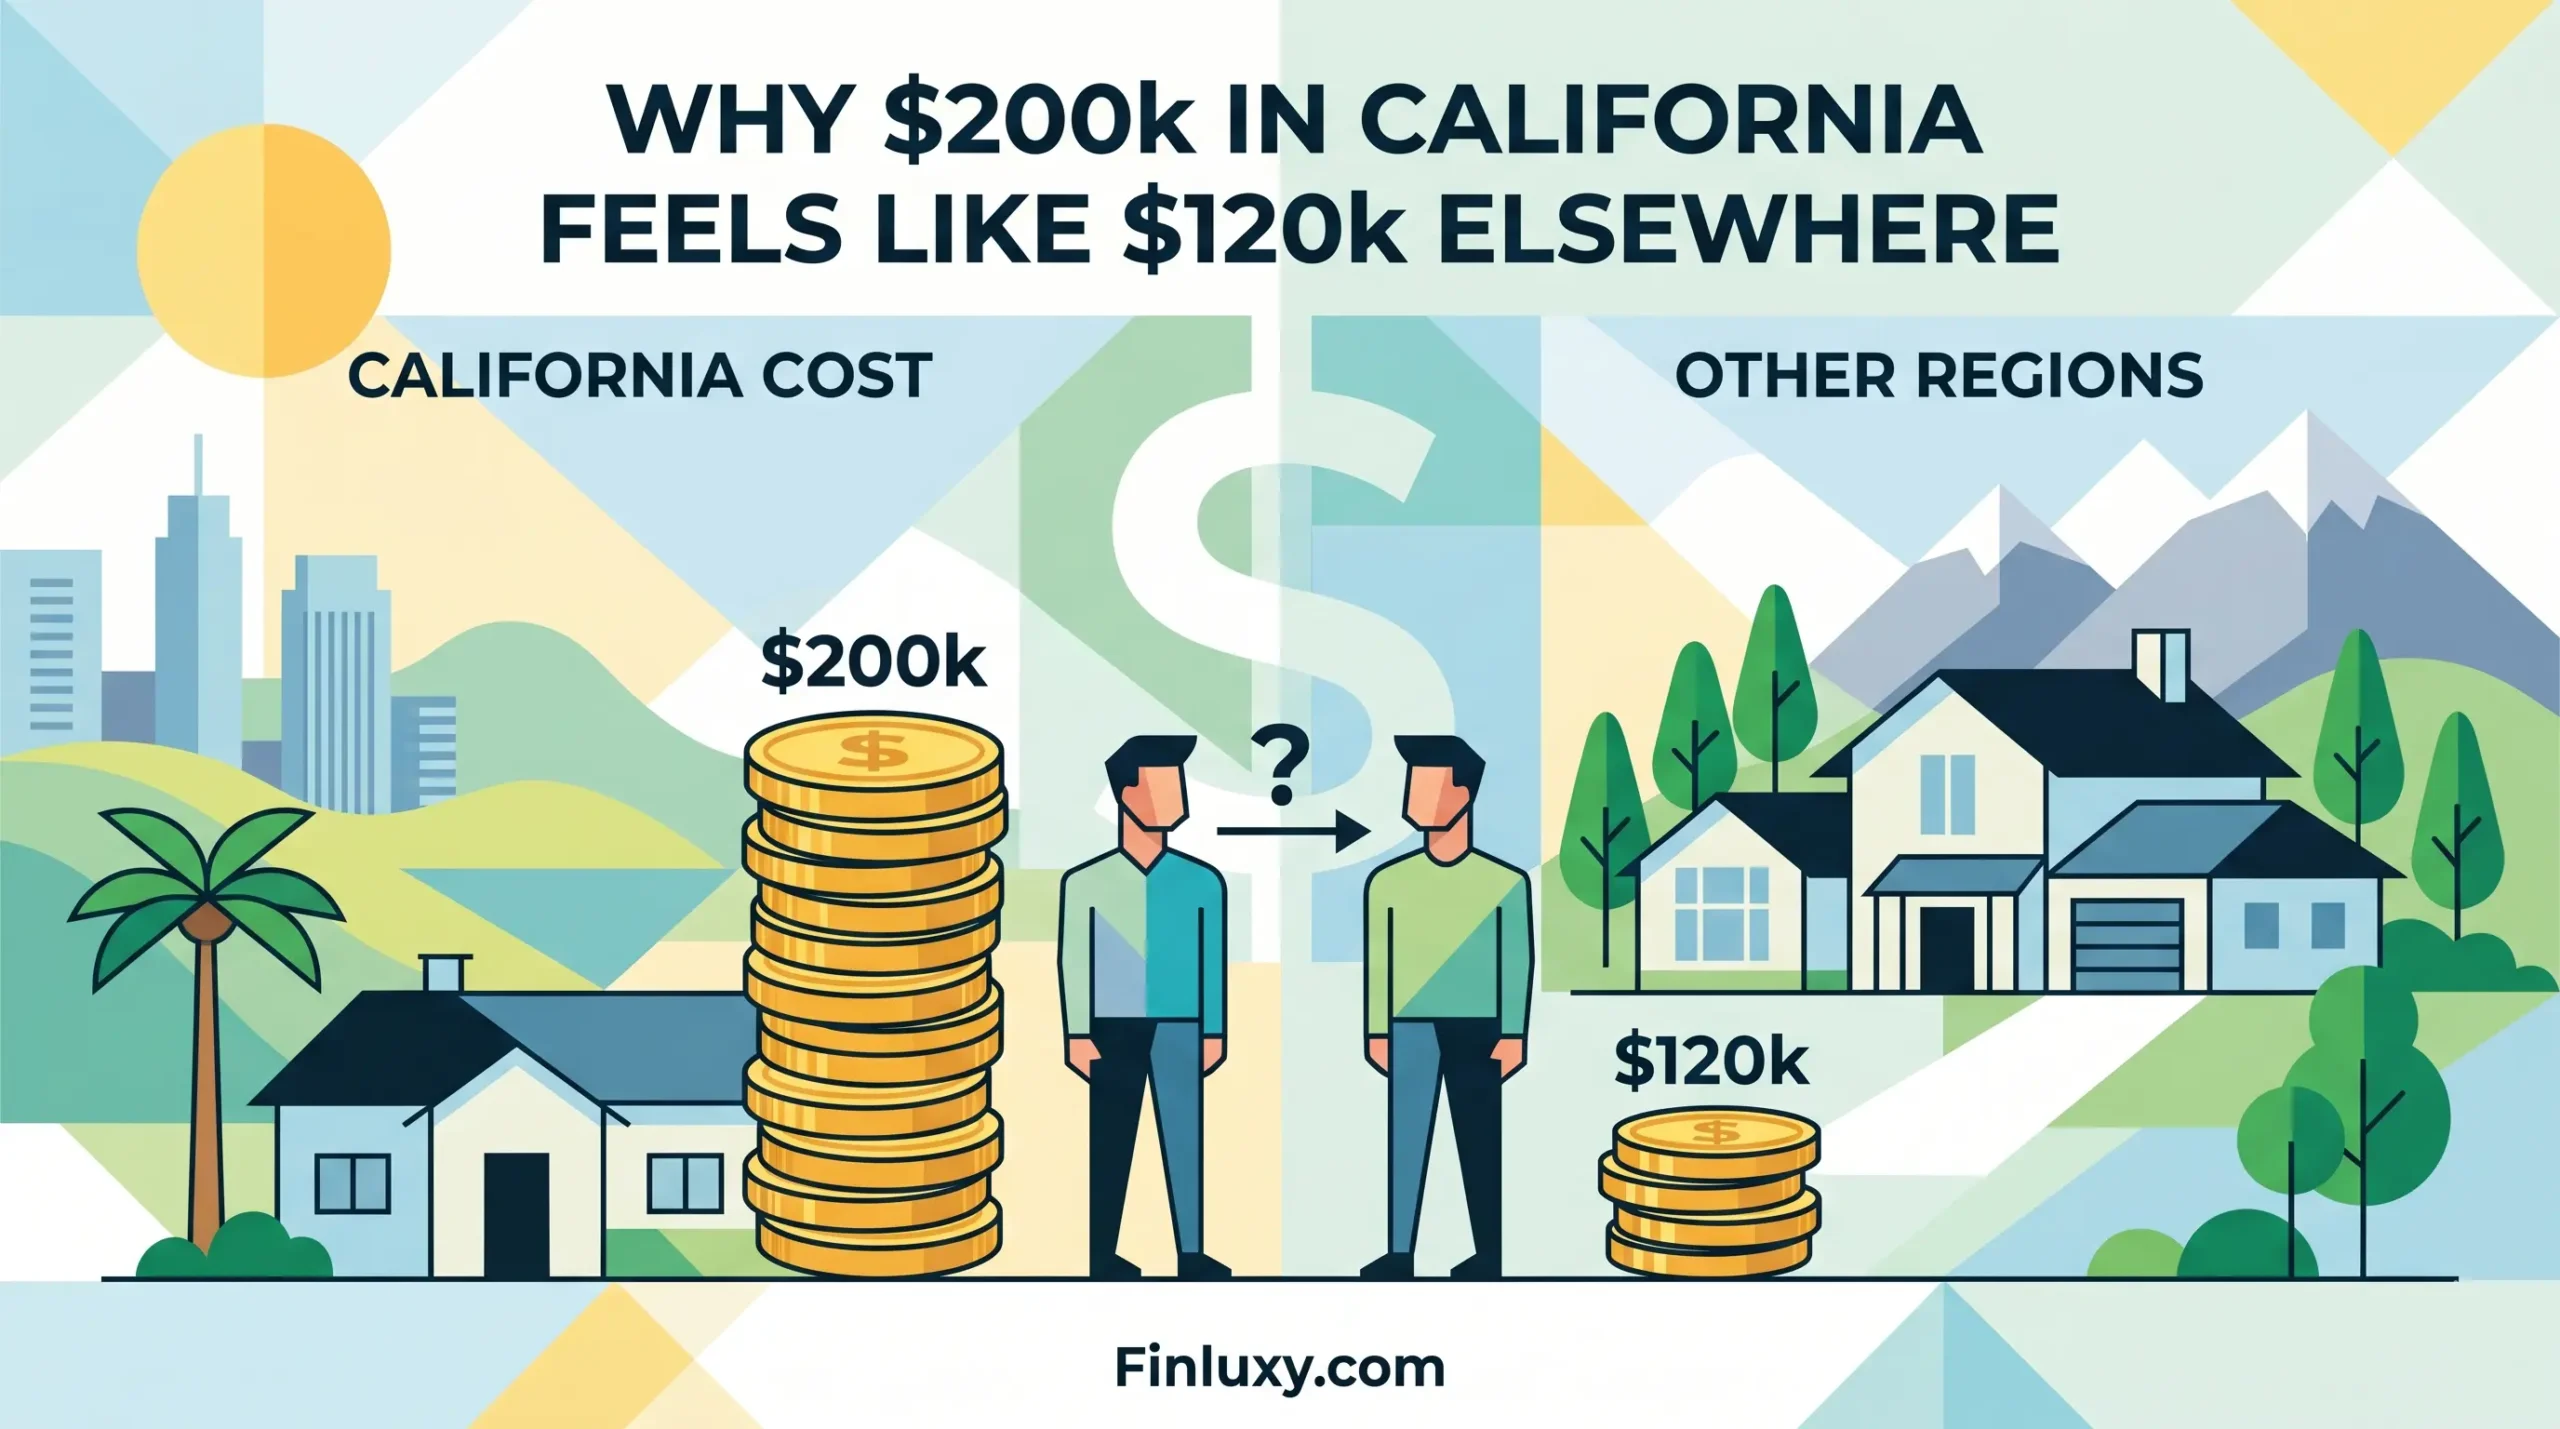
A geometric vector illustration comparing cost of living, featuring stacks of coins representing different values next to houses.

Why $200k in California Feels Like $120k Elsewhere

Geometric vector illustration representing purchasing choices like housing and a car, titled "What $100K Really Buys" with Finluxy.com below.

$100k Income Reality: What It Buys in 2026

Geometric vector illustration comparing city skylines with varying money bags and shopping carts under the title "Purchasing Power at $100k by Metro Area".

Purchasing Power at $100k by Metro Area (2026 Data)

Geometric vector illustration featuring the headline "Disposable Income After Housing at $200k Salary" with premium lifestyle and finance icons.

Disposable Income After Housing at $200k Salary

Geometric vector illustration of a man standing next to a large piggy bank distributing funds to housing, groceries, and investments.

$130k Household Budget: Where Every Dollar Goes

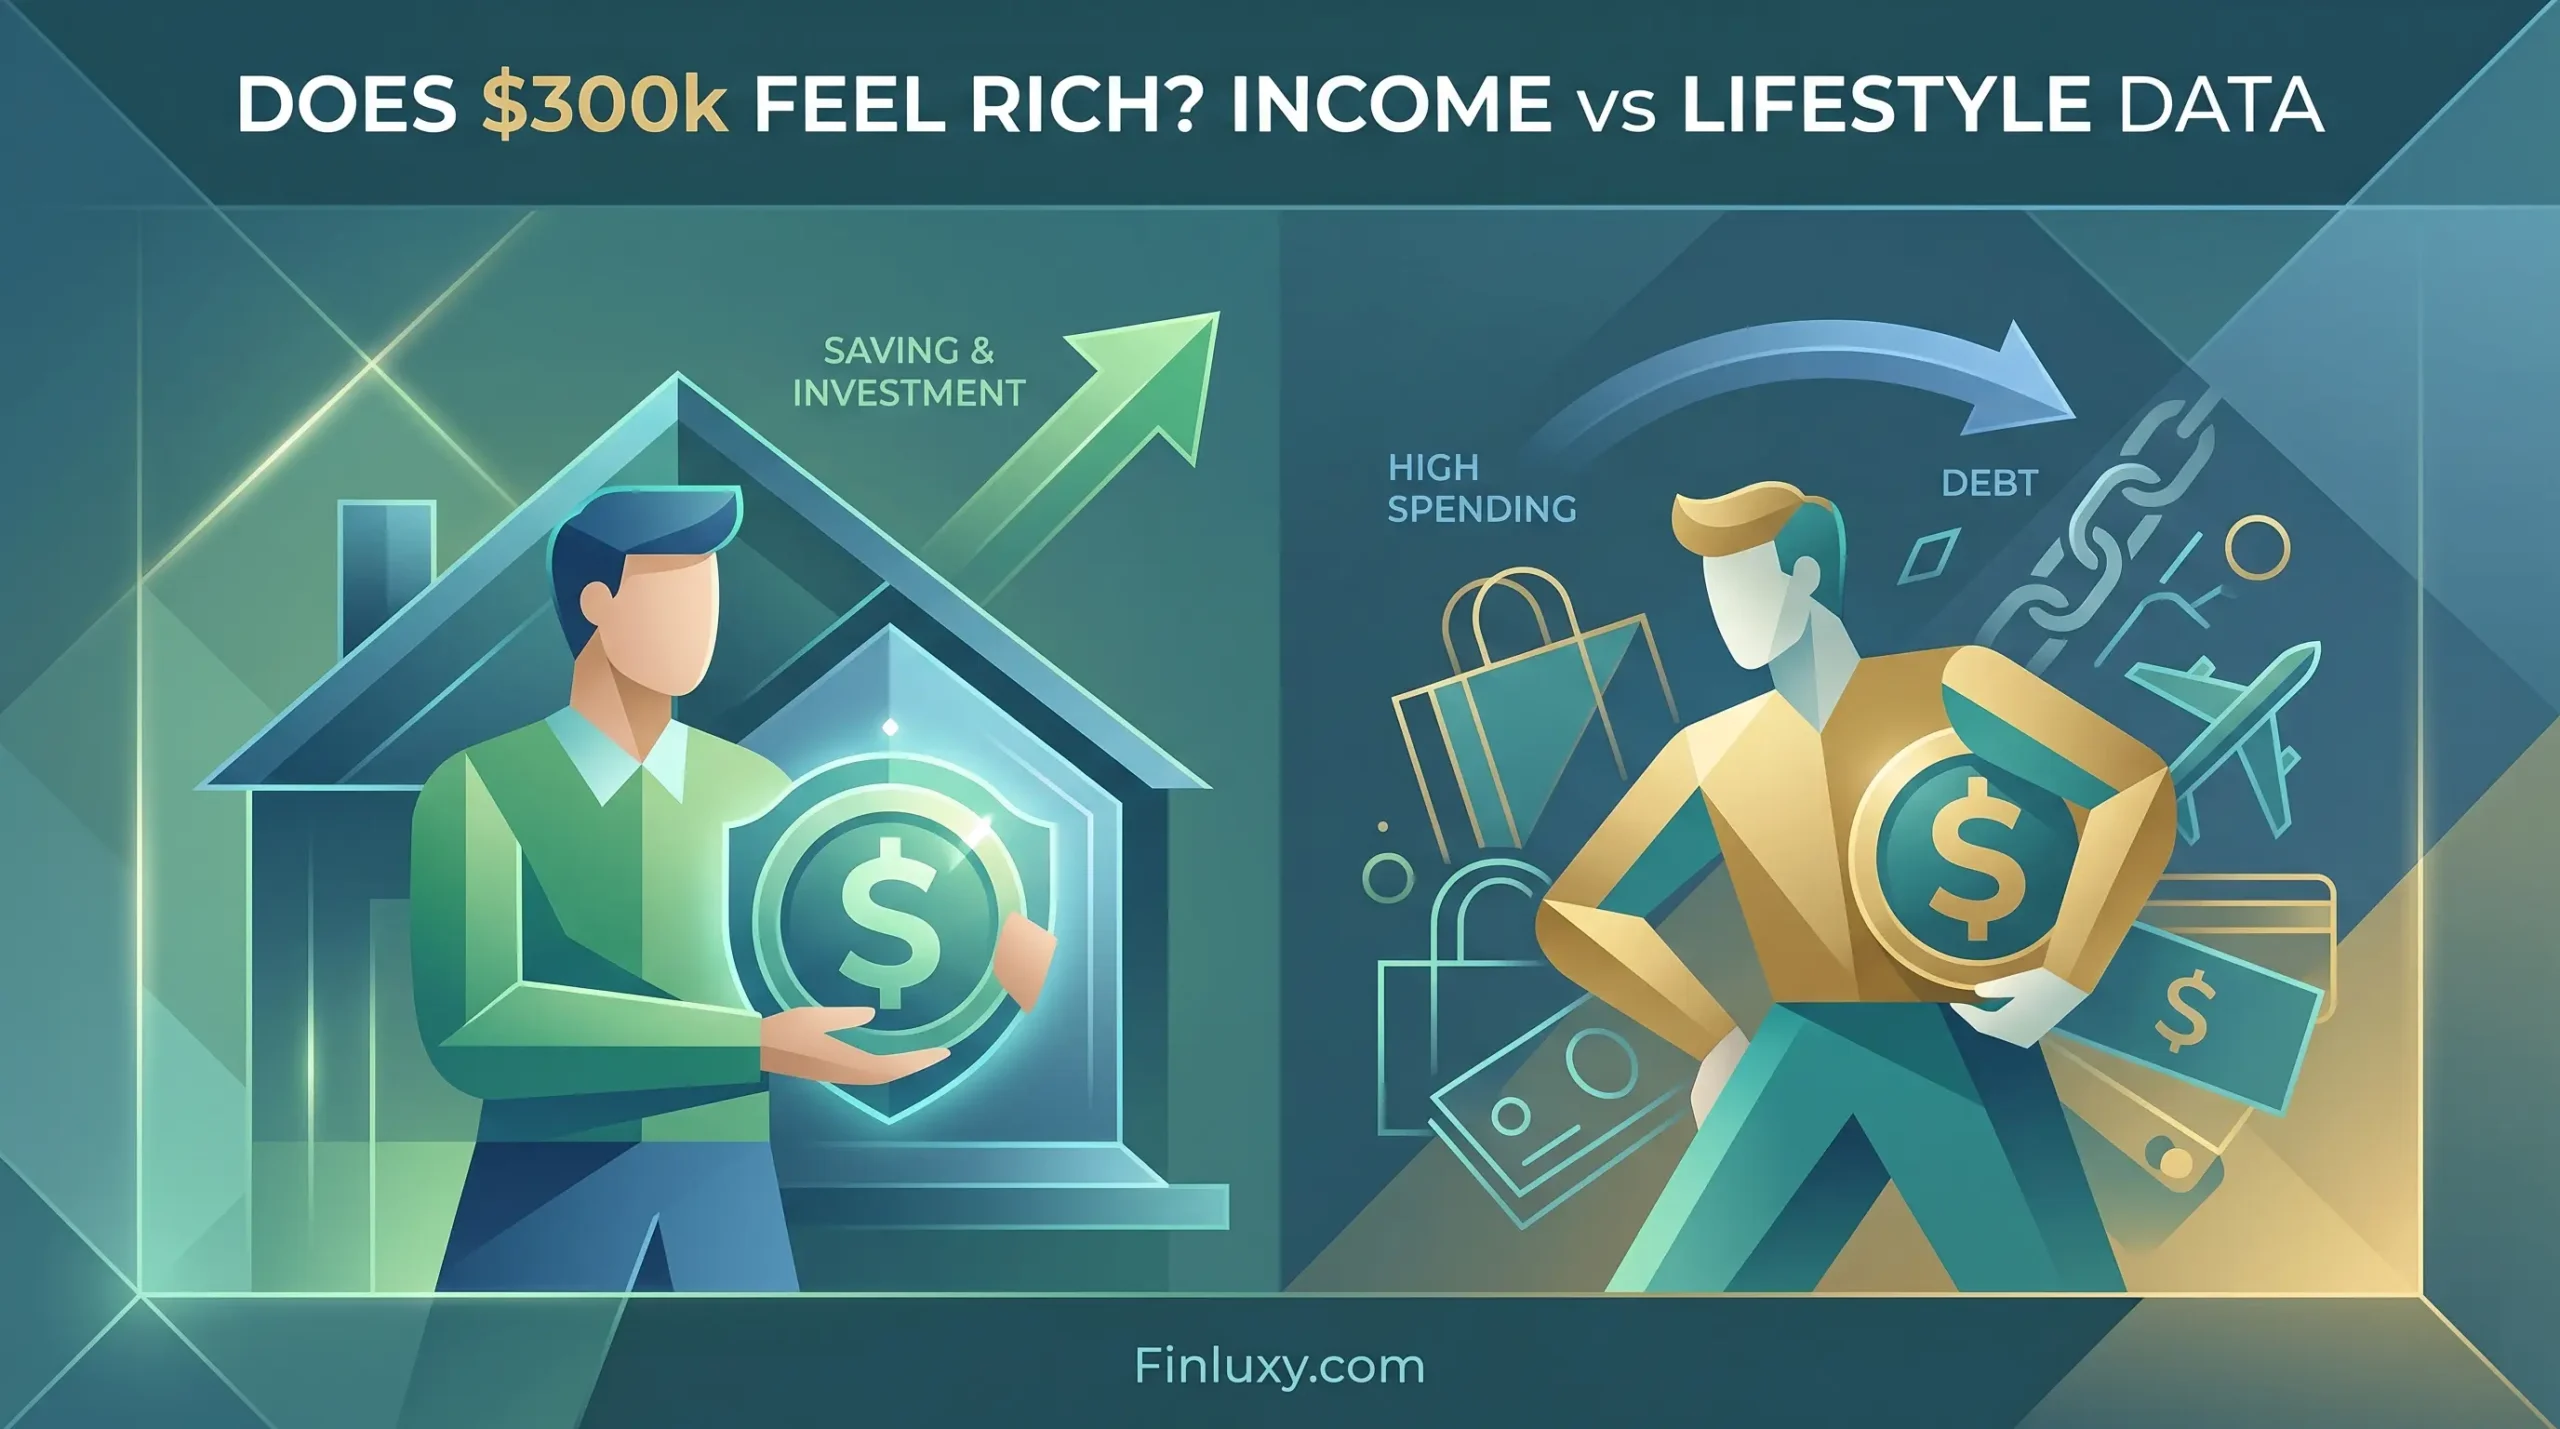
Geometric illustration contrasting an investor building wealth with a high-spender surrounded by debt, titled "Does $300k Feel Rich?".

Does $300k Feel Rich? Income vs Lifestyle Data

Geometric vector illustration of a modern city skyline with a dollar sign, featuring the headline "Why $100k Feels Middle Class in These 10 Cities".

Why $100k Feels Middle Class in These 10 Cities

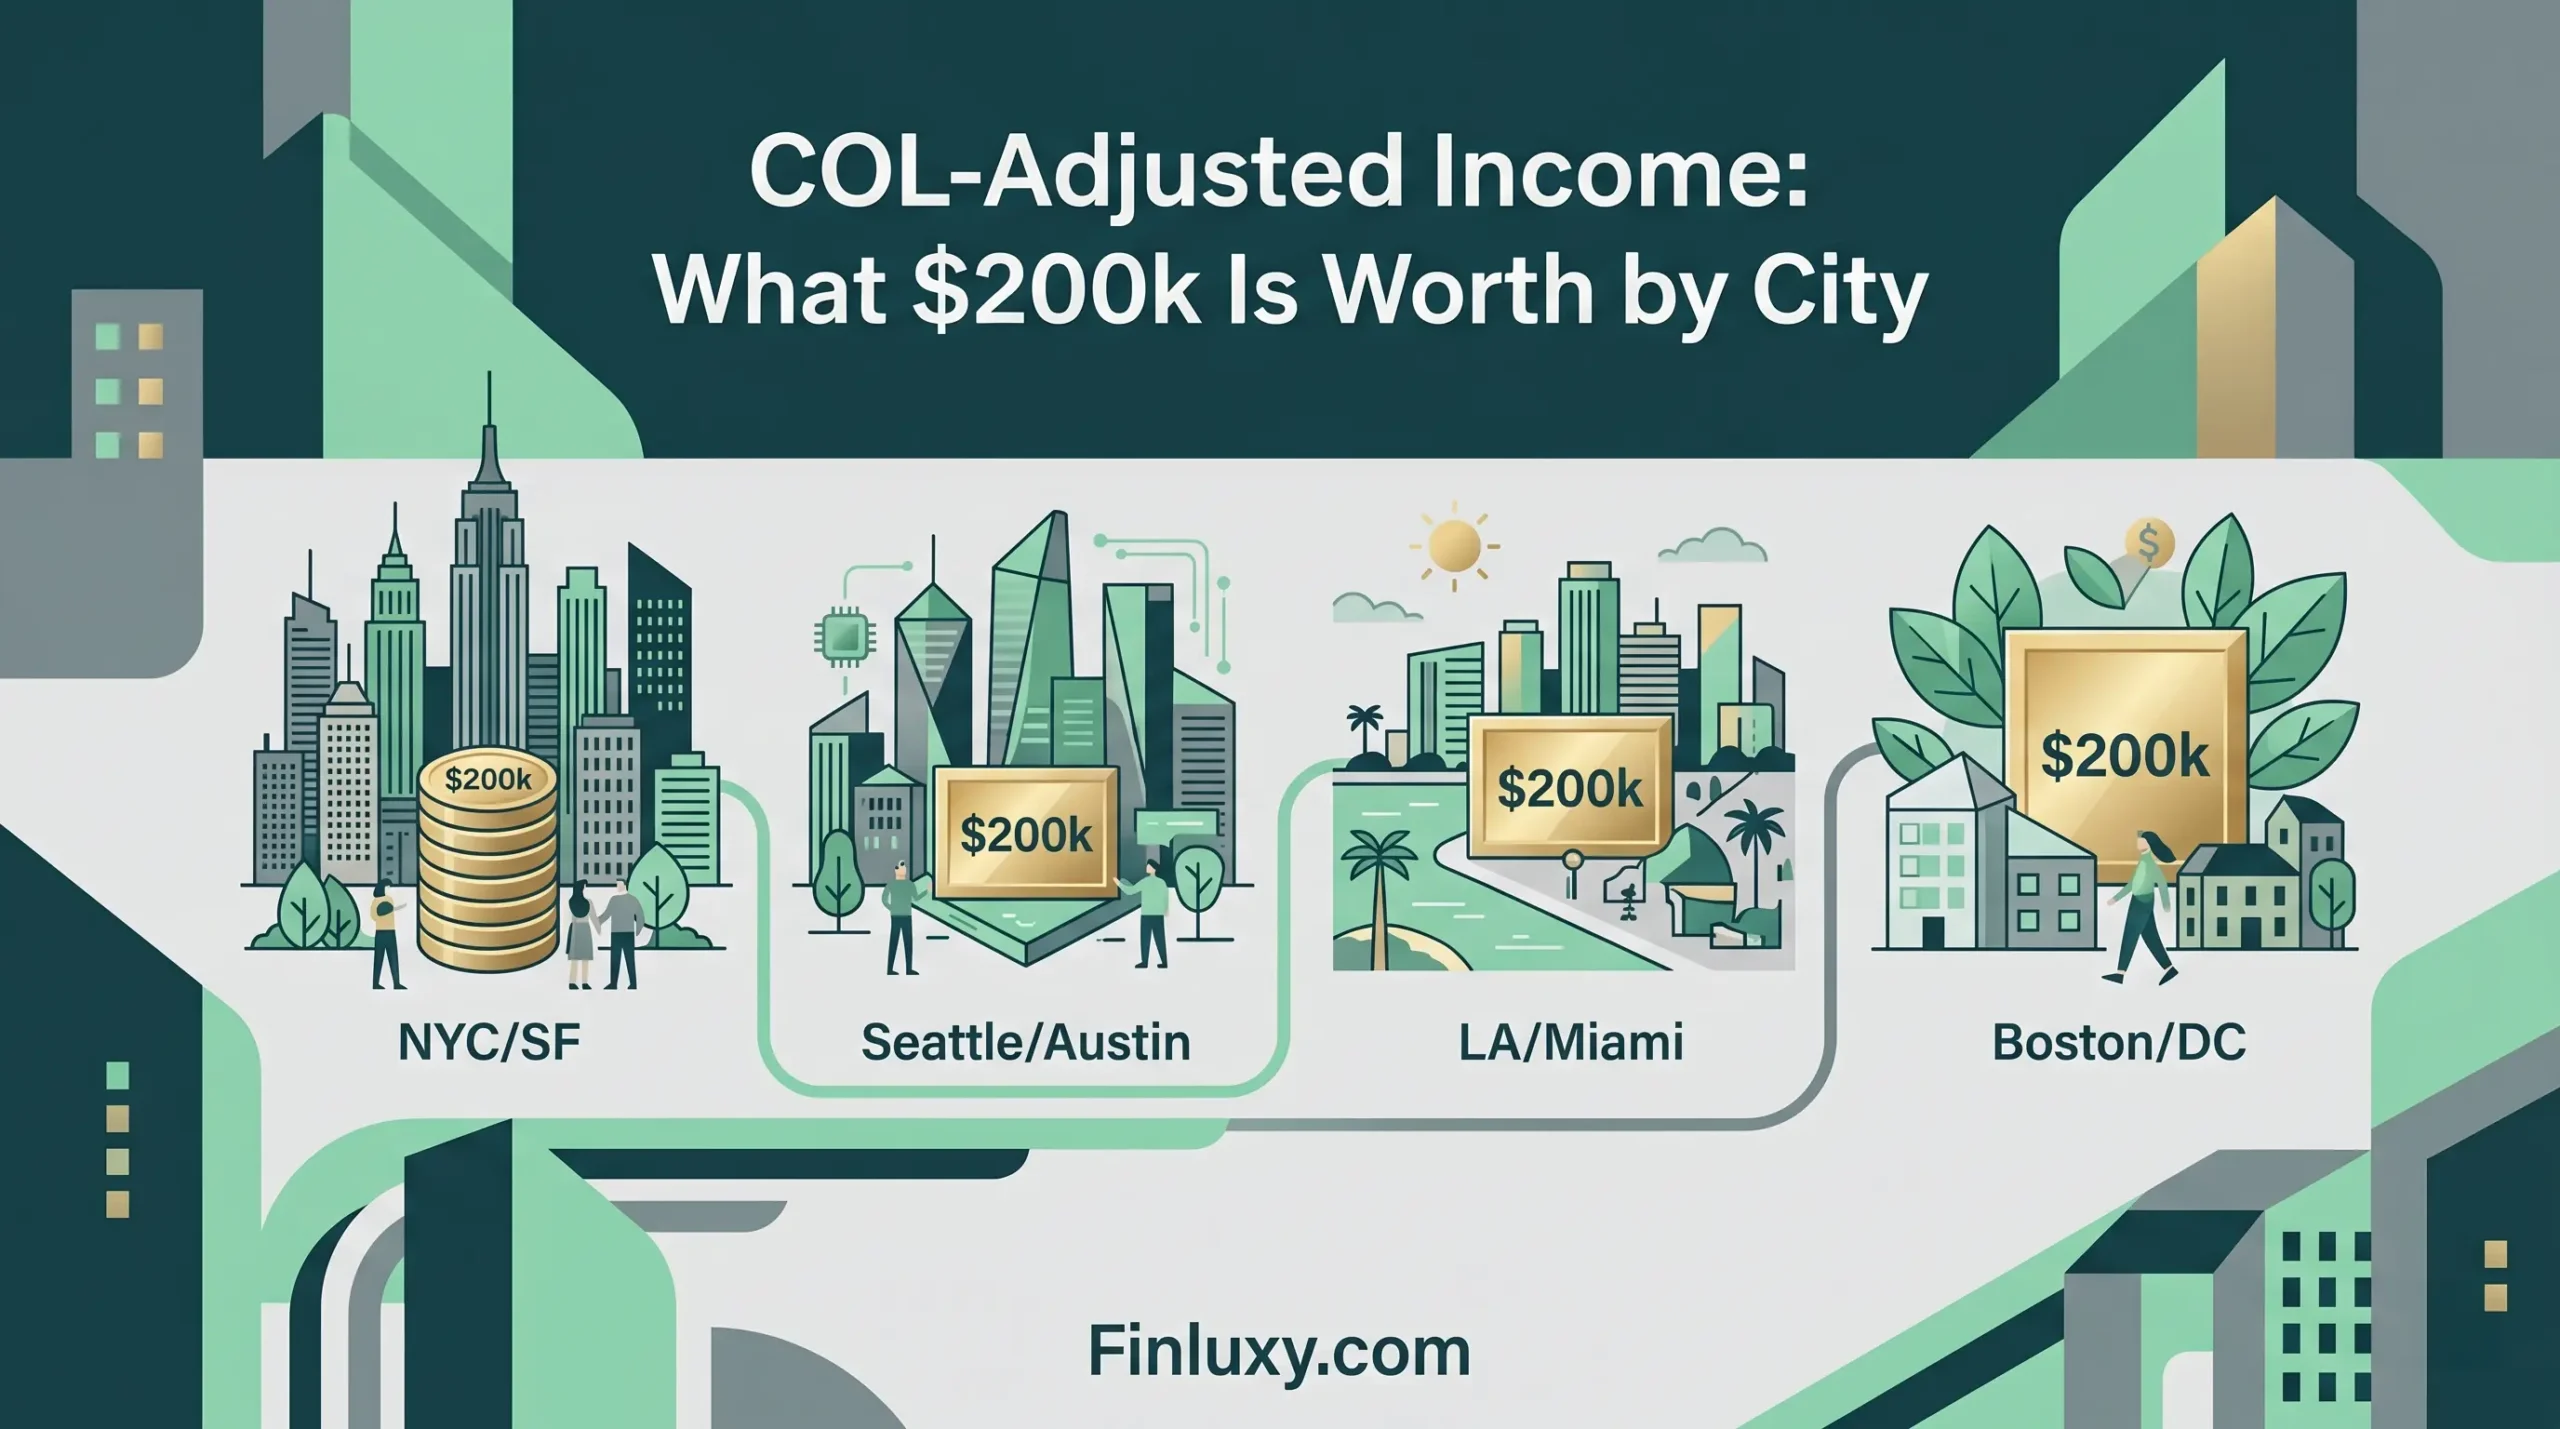
Geometric vector illustration comparing the relative value of a 200k income across different stylized city skyline graphics for Finluxy.com.

COL-Adjusted Income: What $200k Is Worth by City

Geometric vector illustration of a worried professional next to stacked boxes and falling coins, with headline text and Finluxy.com.

Six Figures and Still Broke: Why It Happens

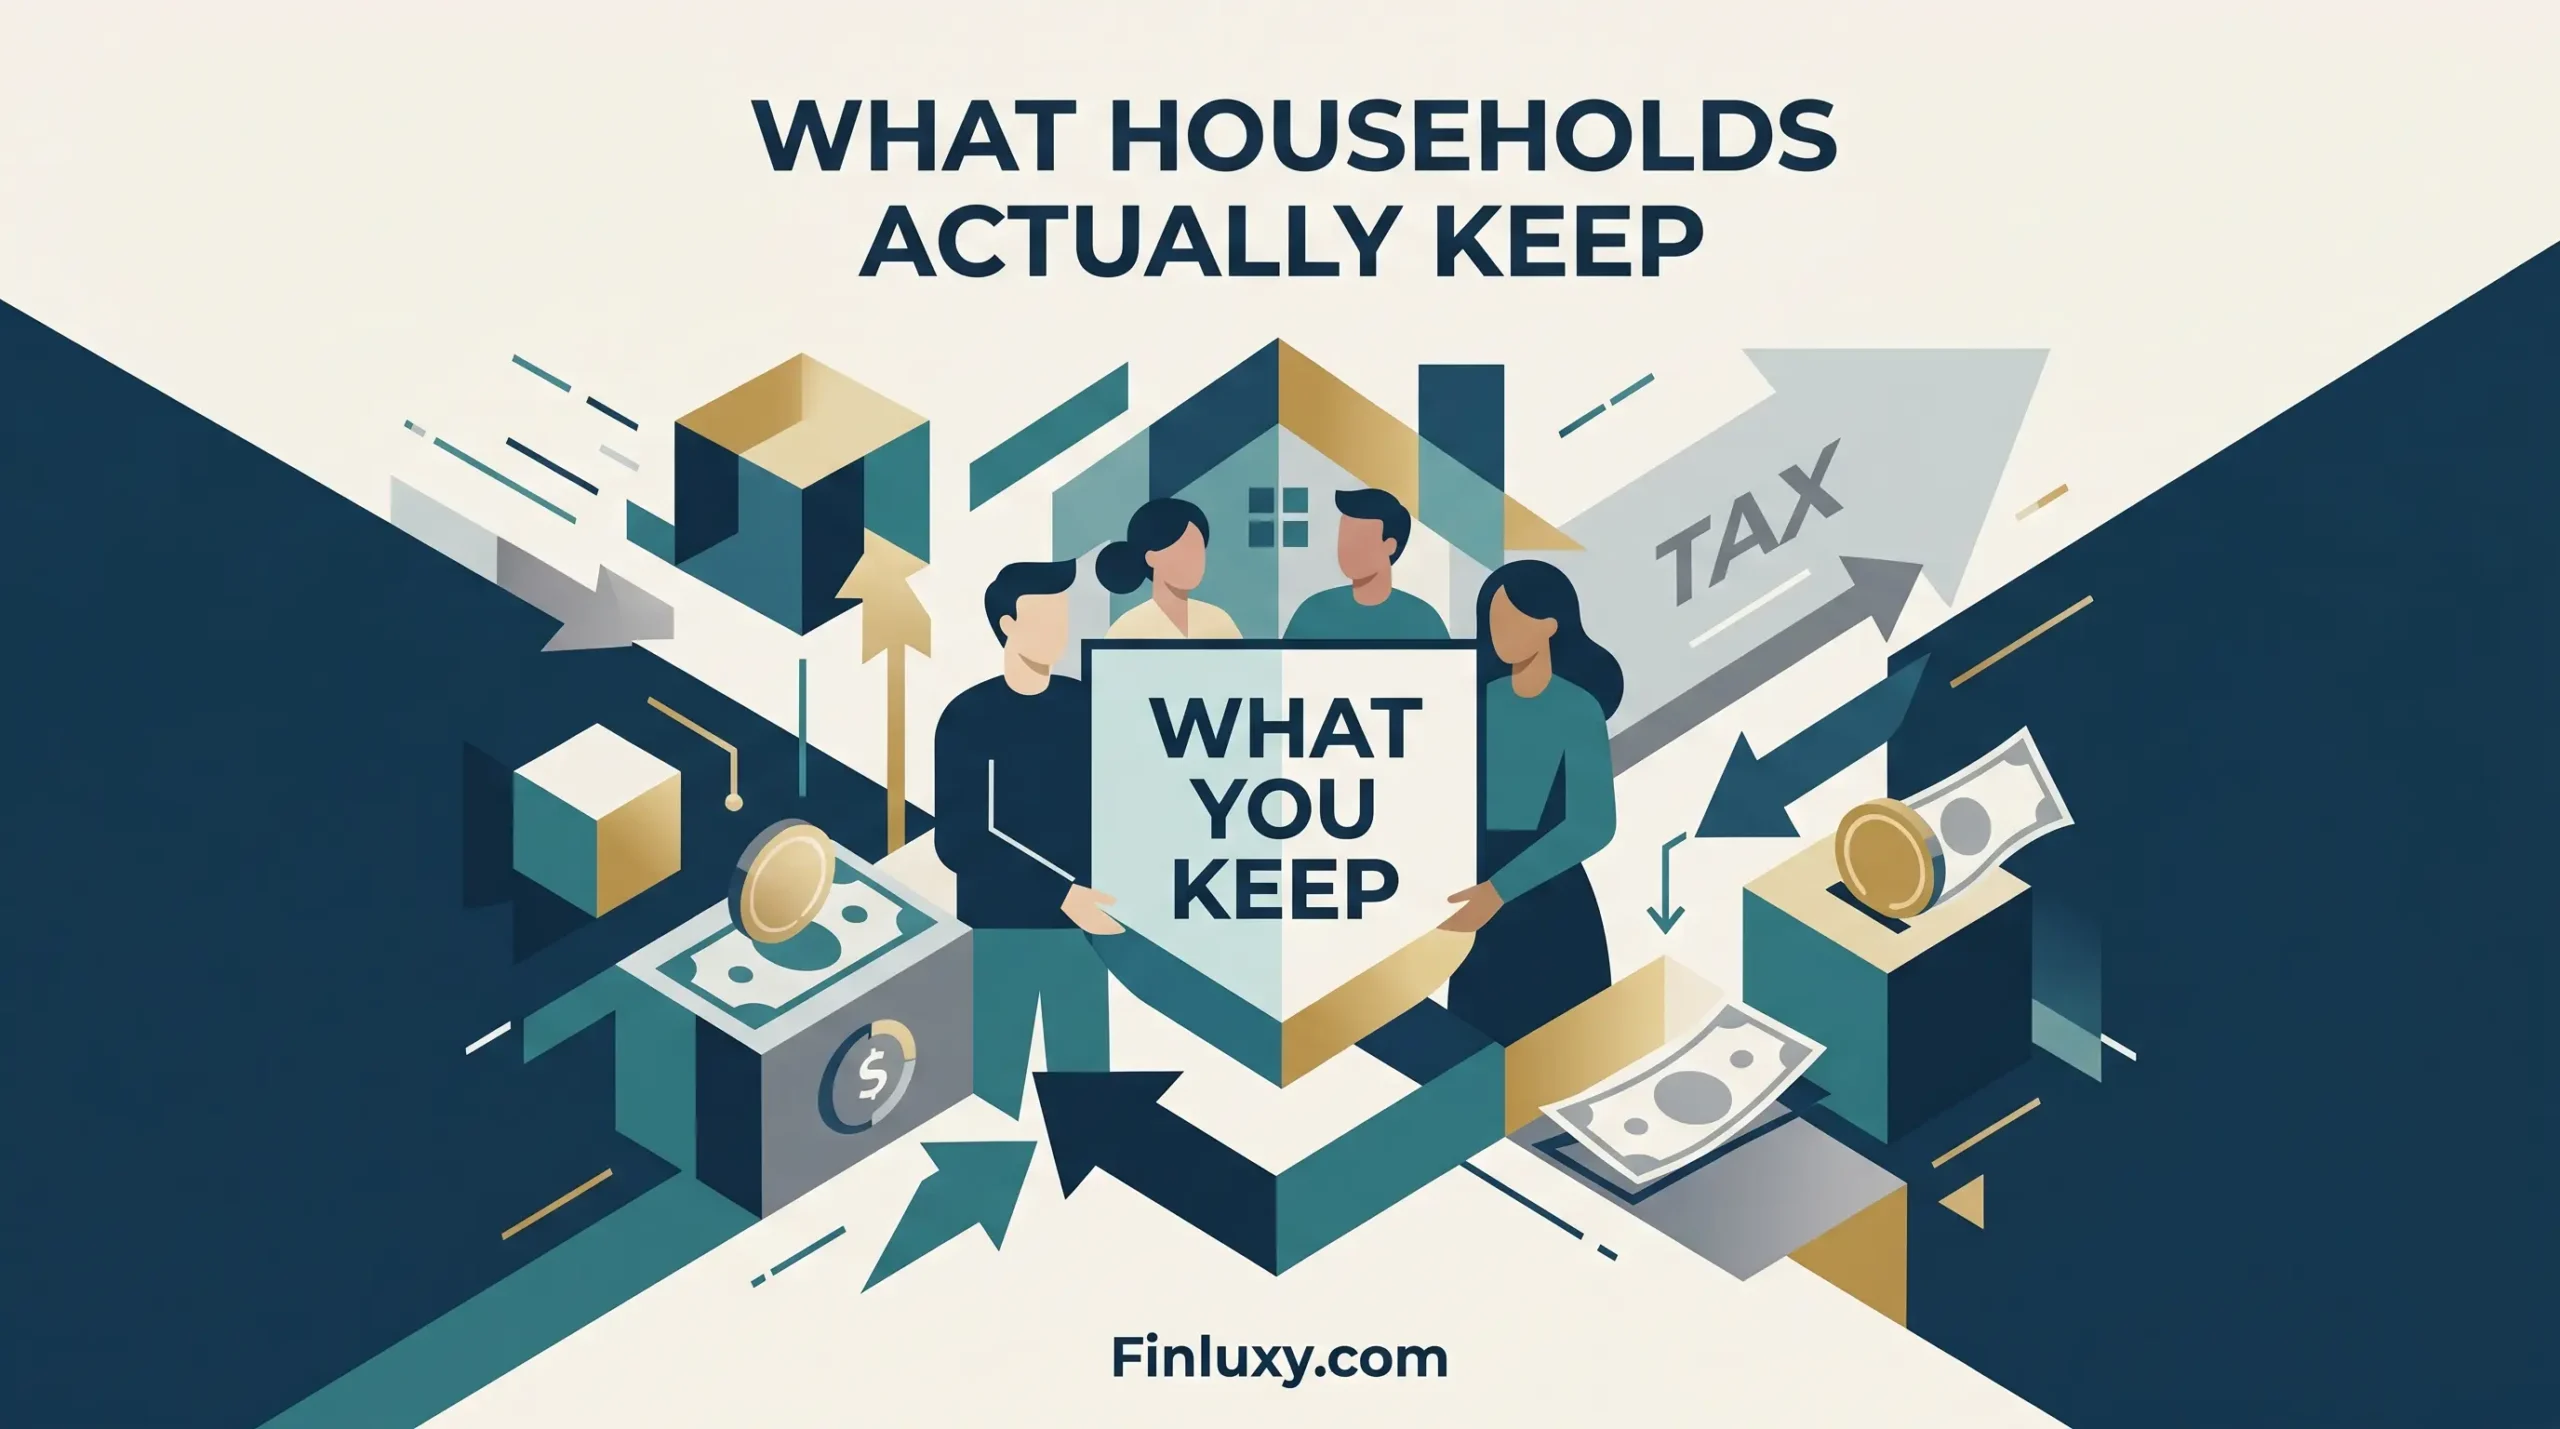
Geometric vector illustration of a household holding a shield labeled "What You Keep," surrounded by abstract financial elements.

$120k Income After Tax: What Households Actually Keep

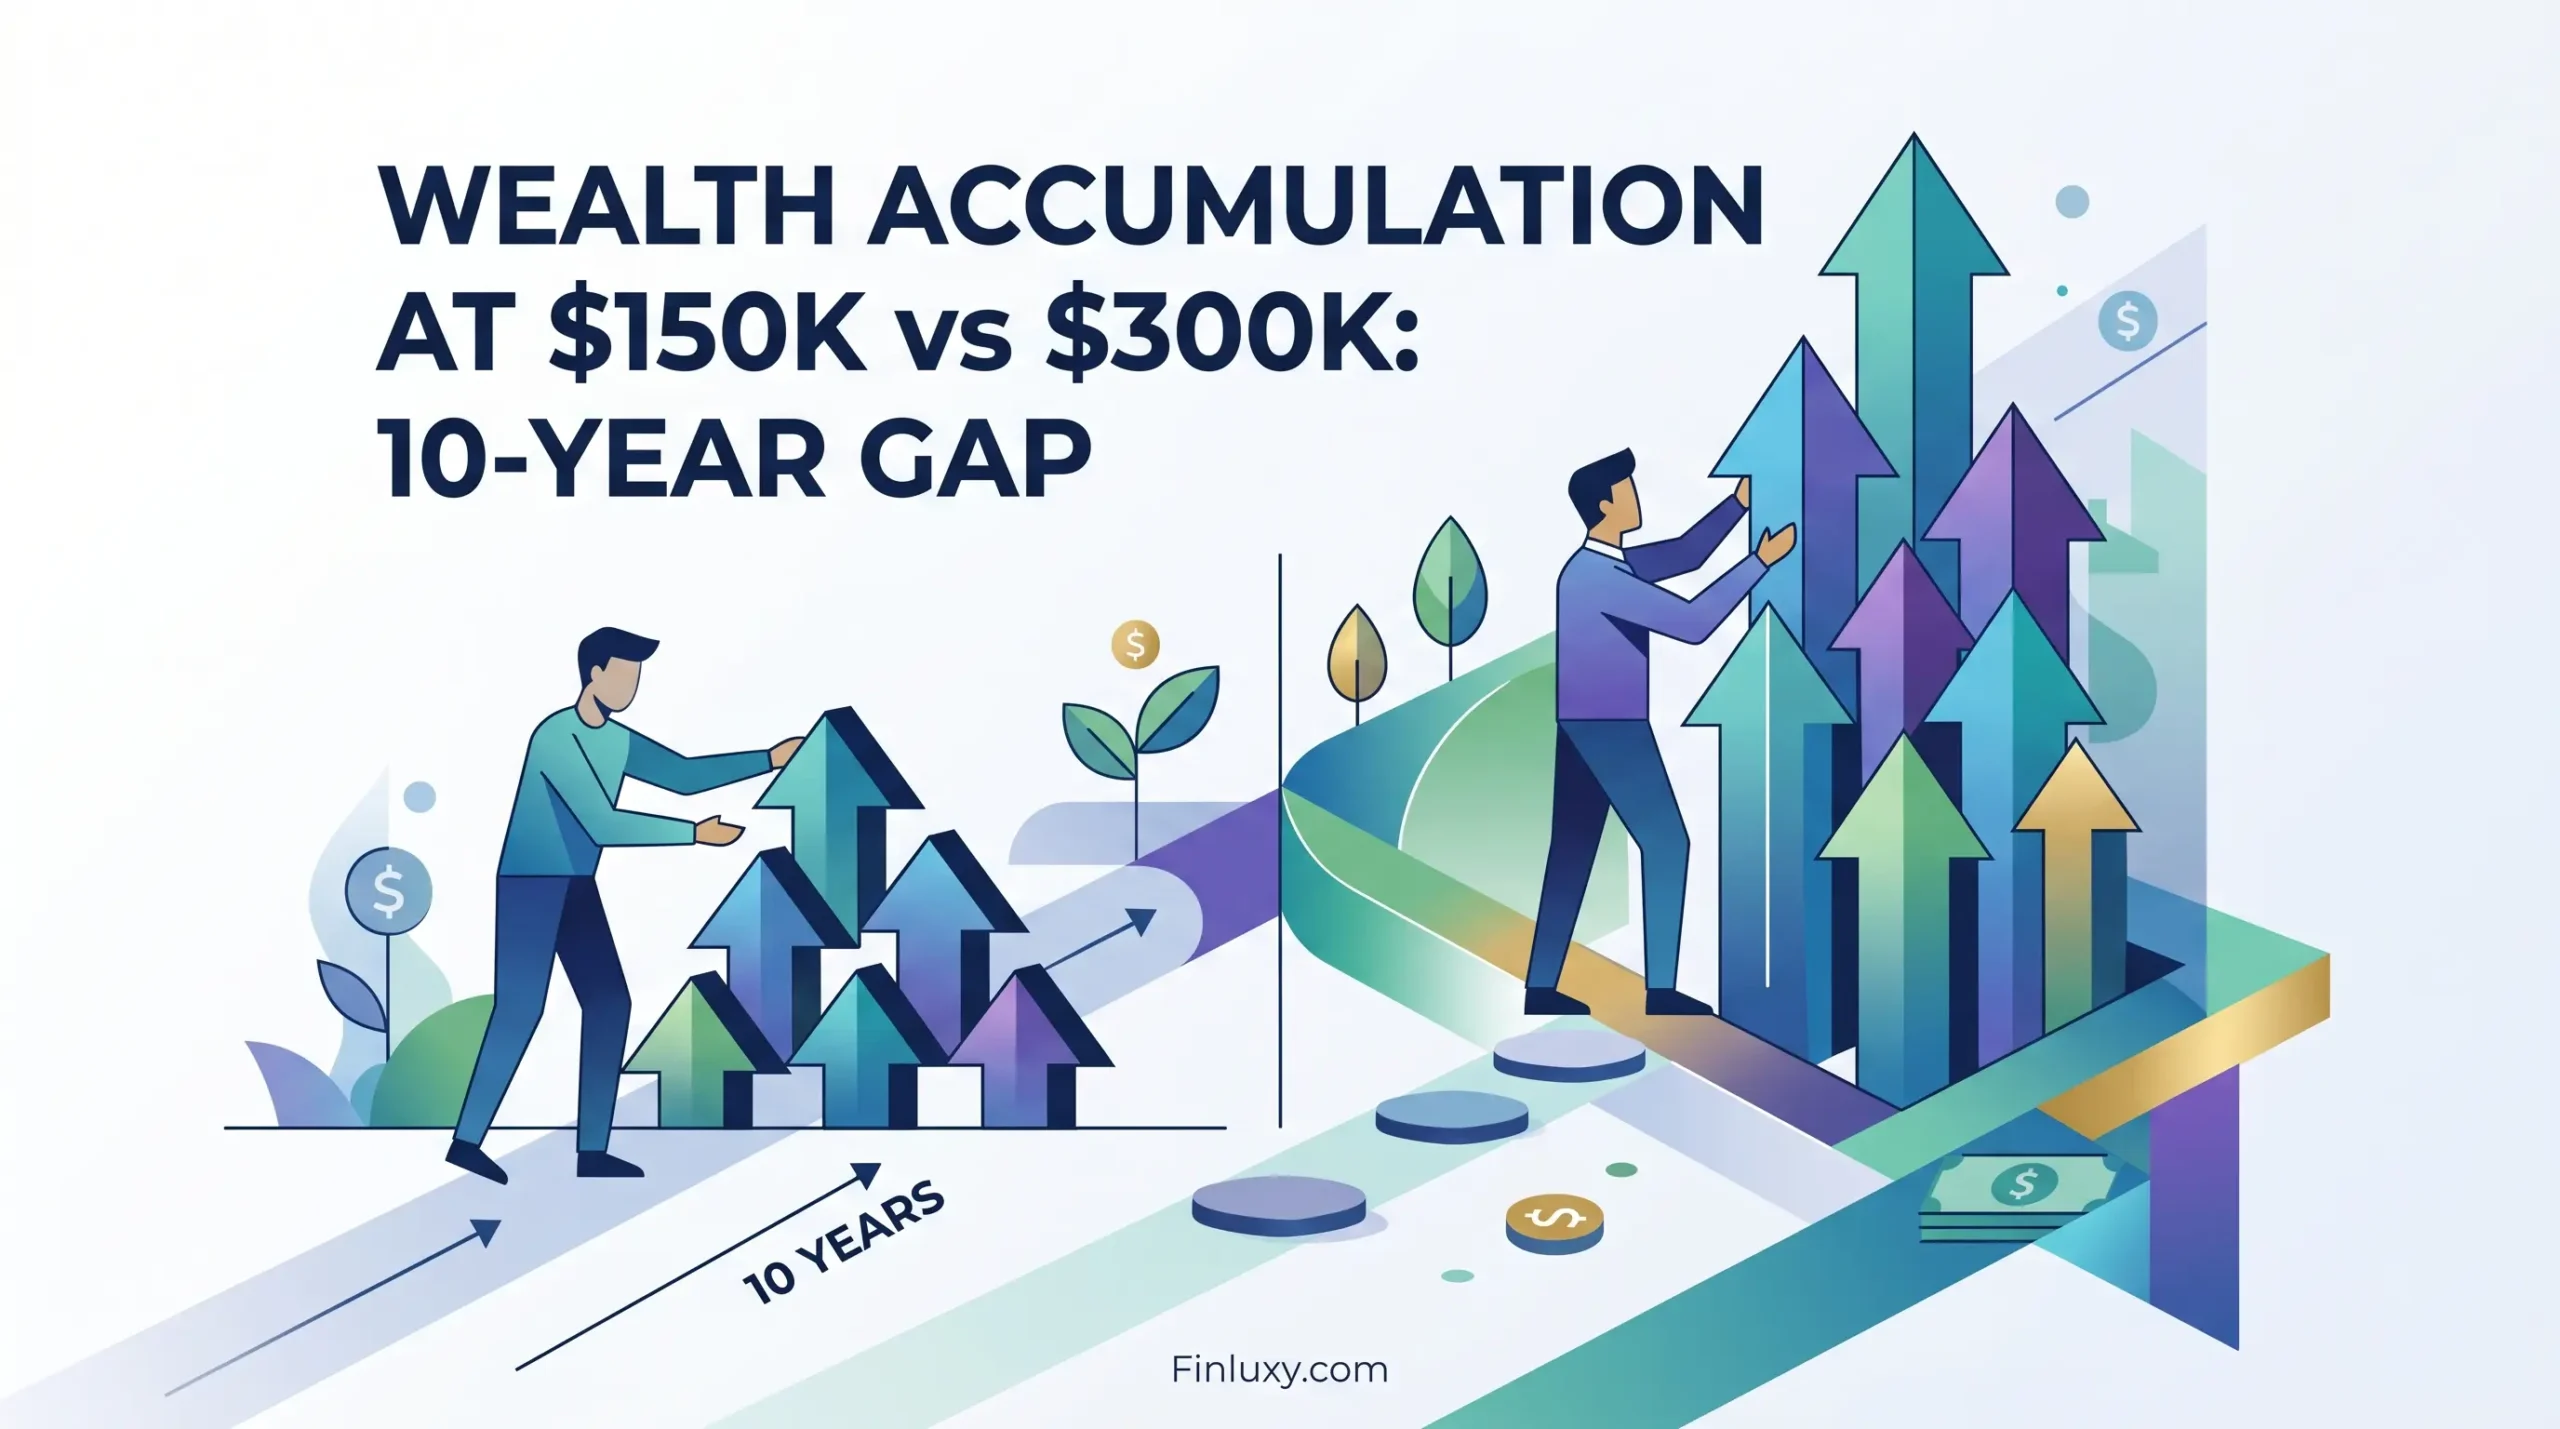
Geometric vector illustration comparing two wealth paths with arrows rising at different heights, featuring Finluxy headline and website URL.

Wealth Accumulation at $150k vs $300k: 10-Year Gap

Geometric vector illustration featuring a modern house, a tax document, and finance elements with the headline "$200k Salary Reality."

$200k Salary Reality: Housing, Tax, and What’s Left

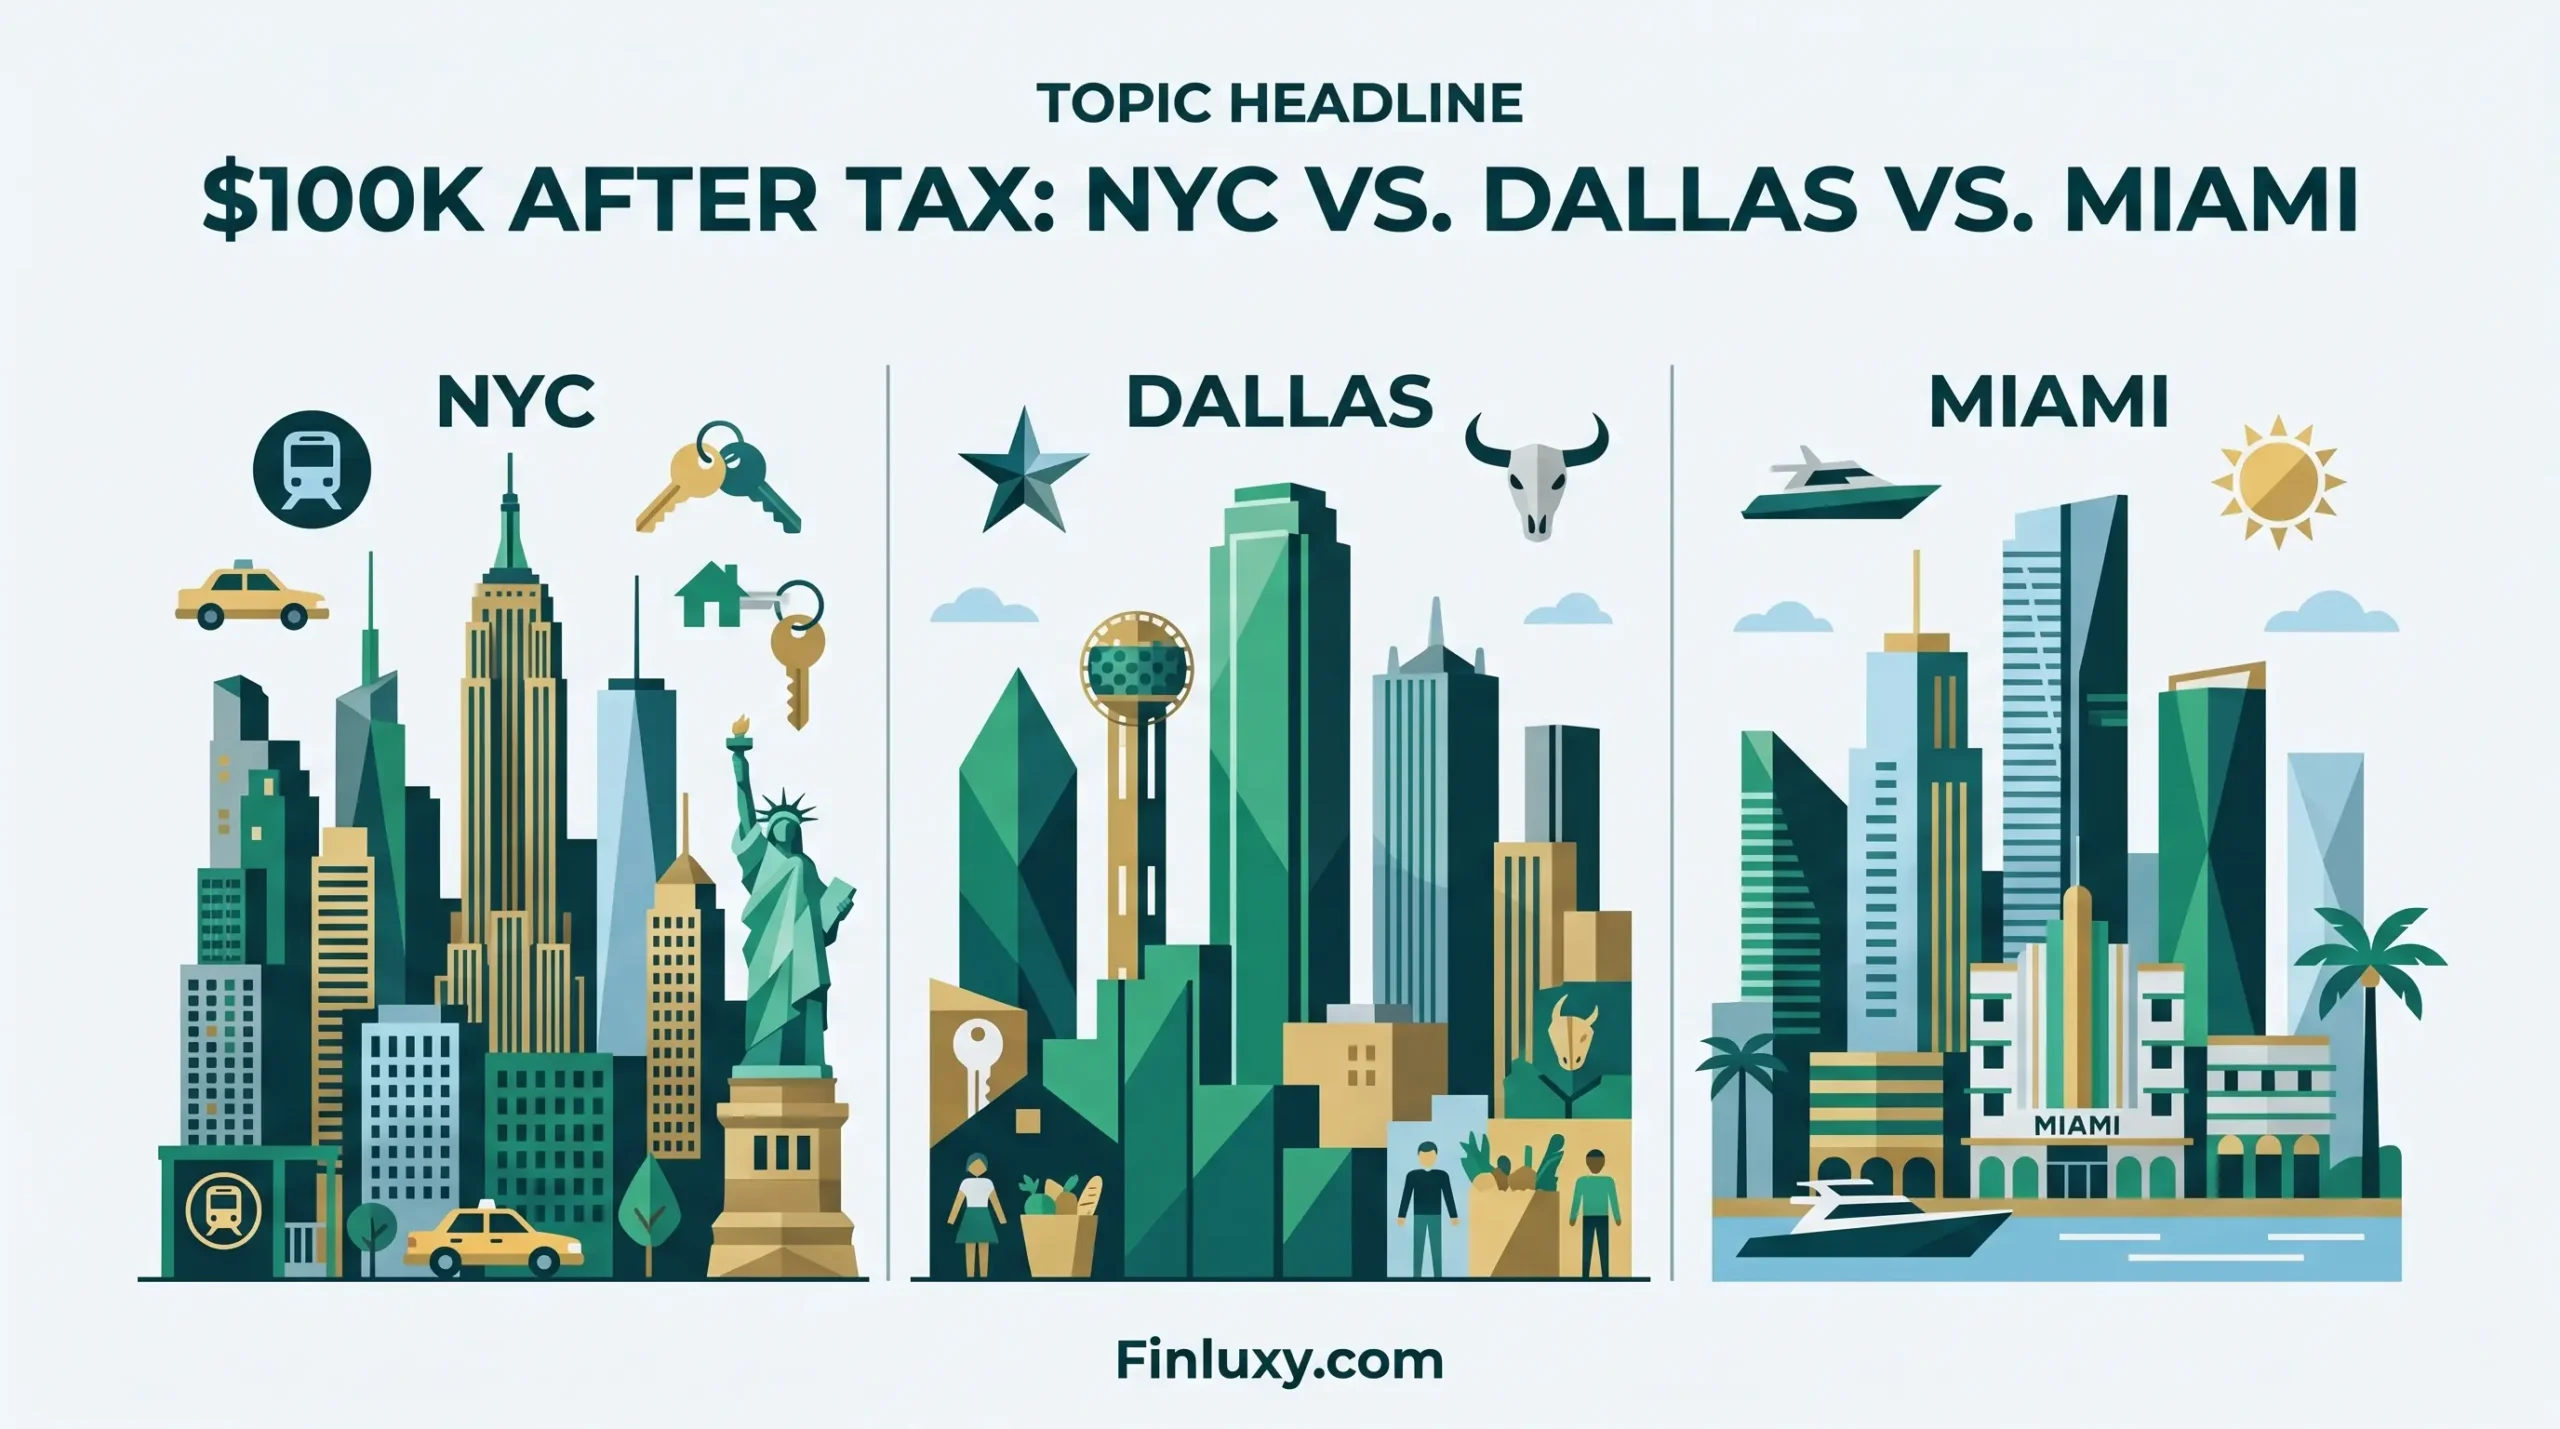
Geometric vector illustration comparing NYC, Dallas, and Miami skylines for a personal finance article, featuring Finluxy.com at the bottom.

$100k After Tax in NYC vs Dallas vs Miami

Geometric vector illustration comparing a spacious suburban house with coins to a dense San Francisco skyline with a cable car.

$90k in a Low-Cost City vs $150k in San Francisco

Geometric vector illustration of a professional in San Francisco with budget icons, the Golden Gate Bridge, and the Finluxy logo.

$150k Income in San Francisco: Monthly Budget Math

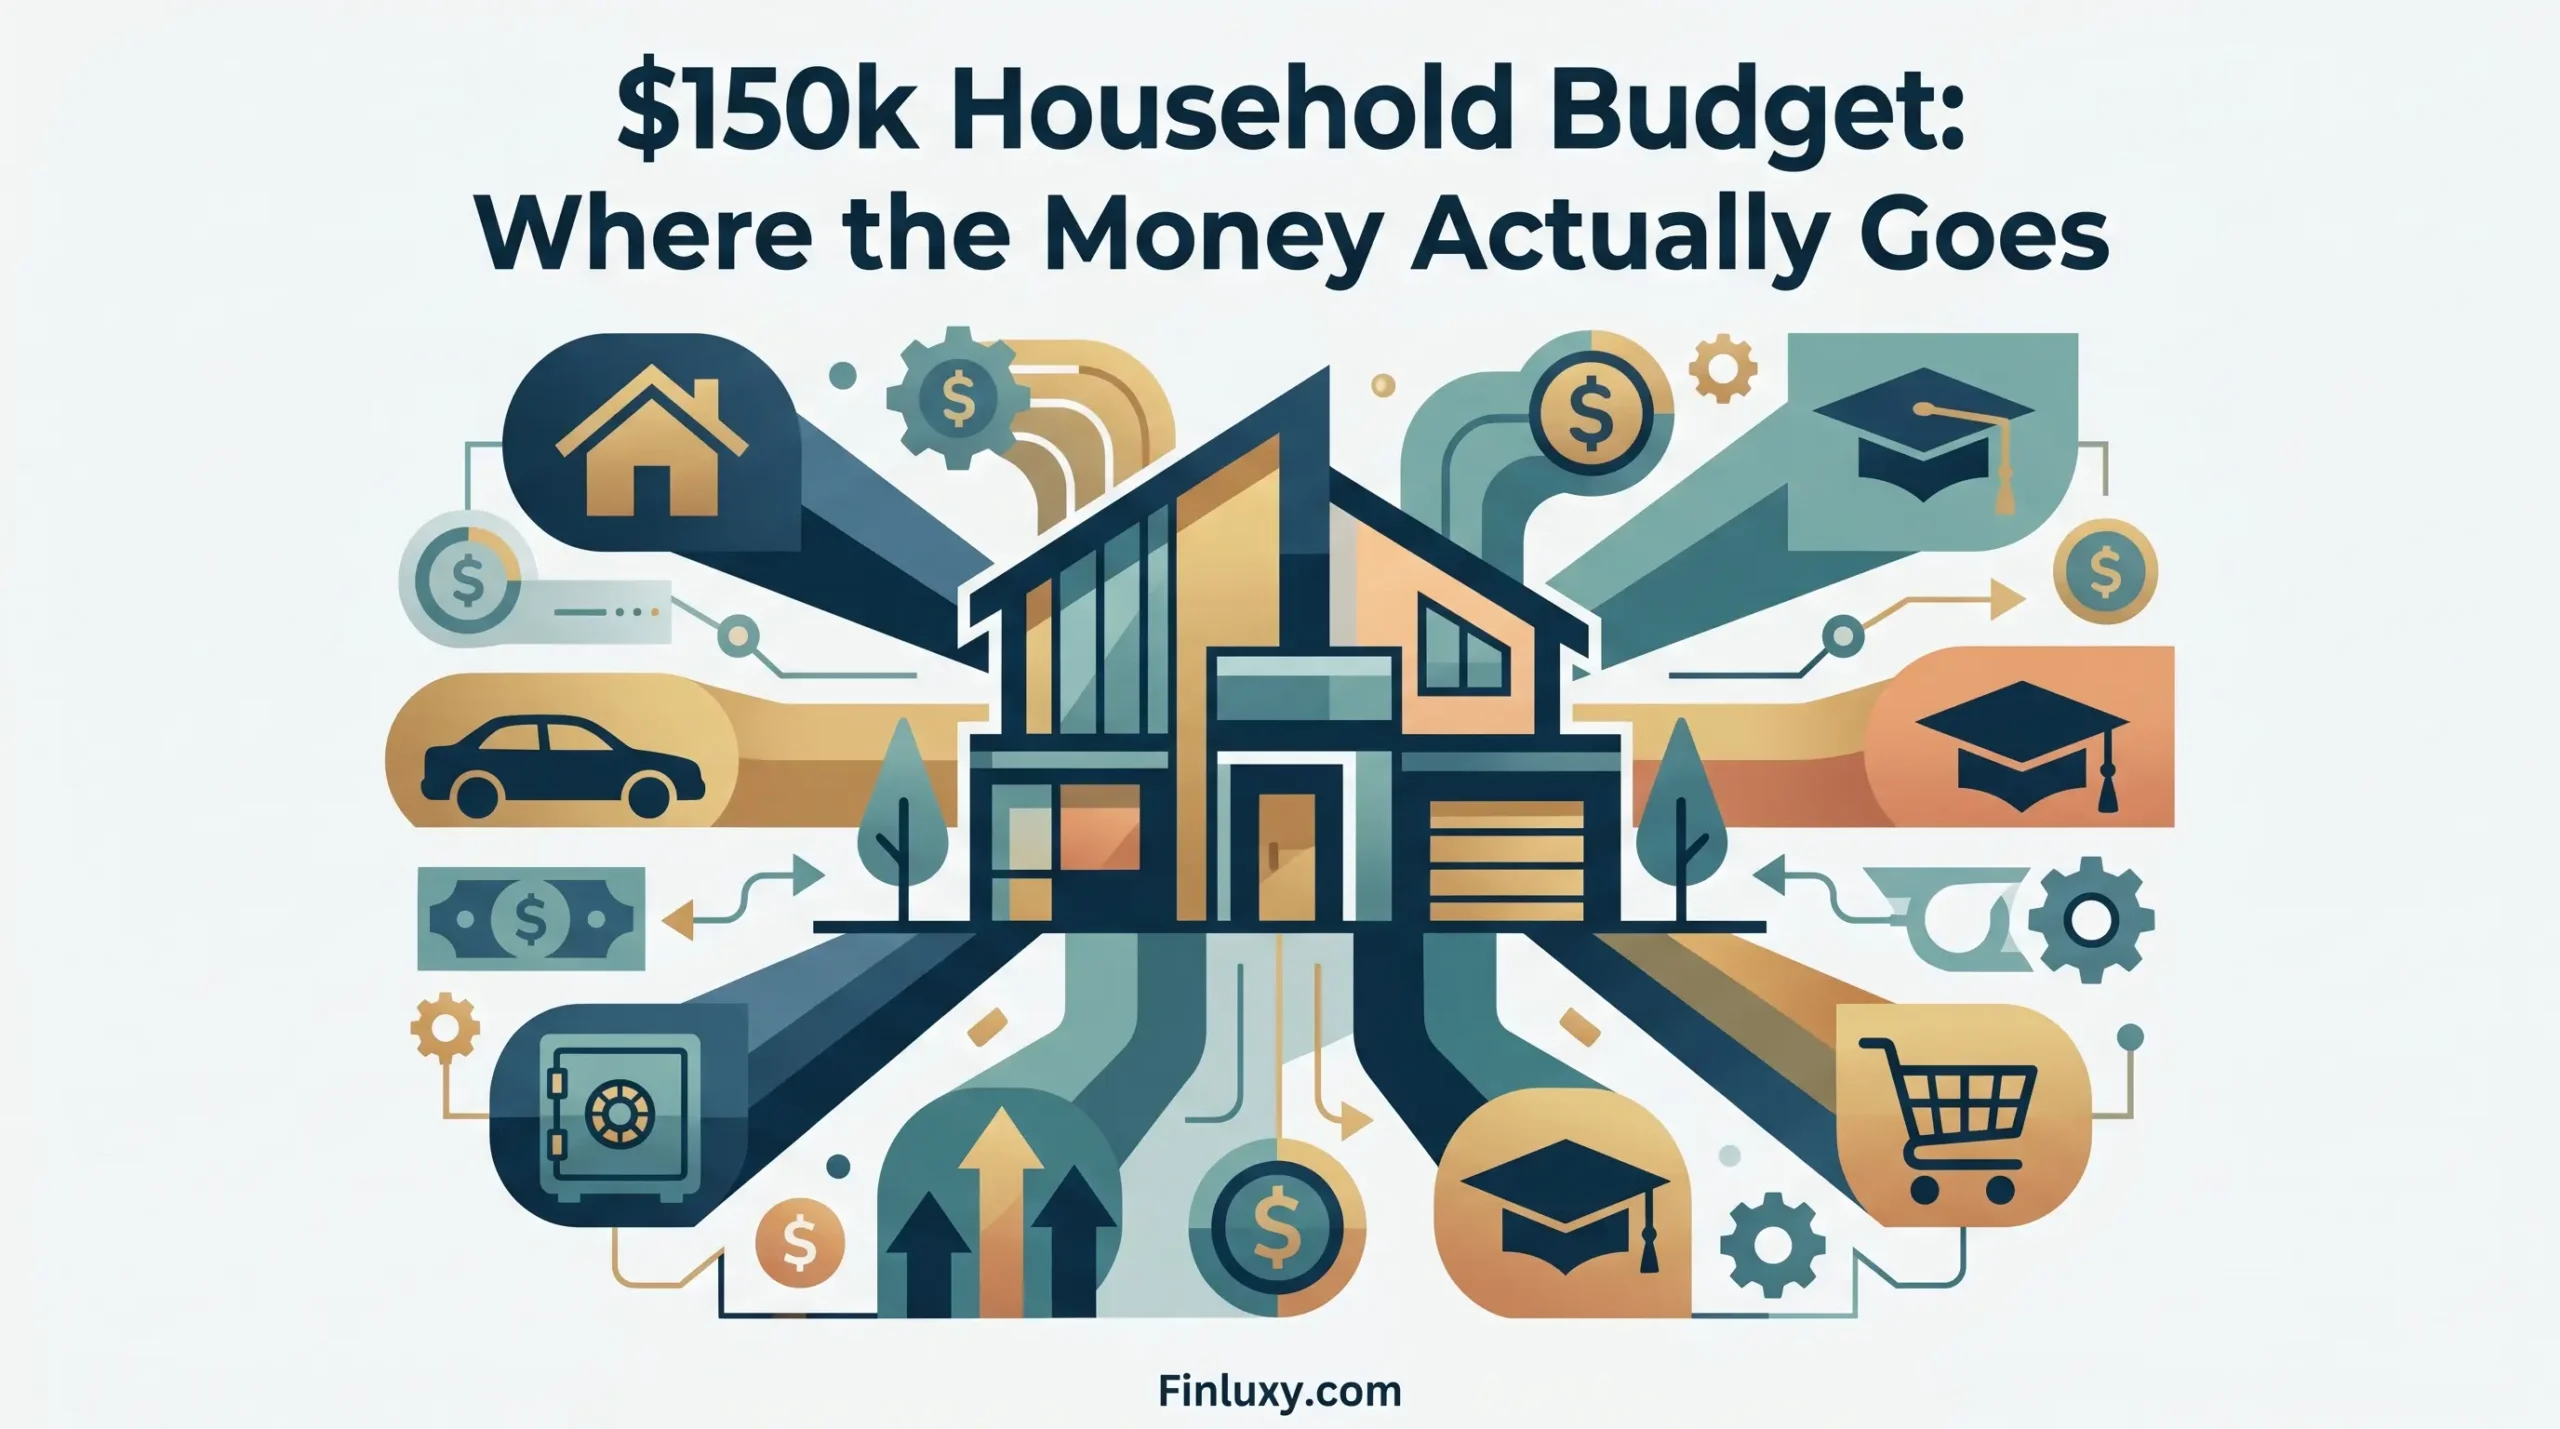
Geometric vector illustration of a modern house surrounded by pathways and icons for housing, transport, education, and savings, for Finluxy.

$150k Household Budget: Where the Money Actually Goes

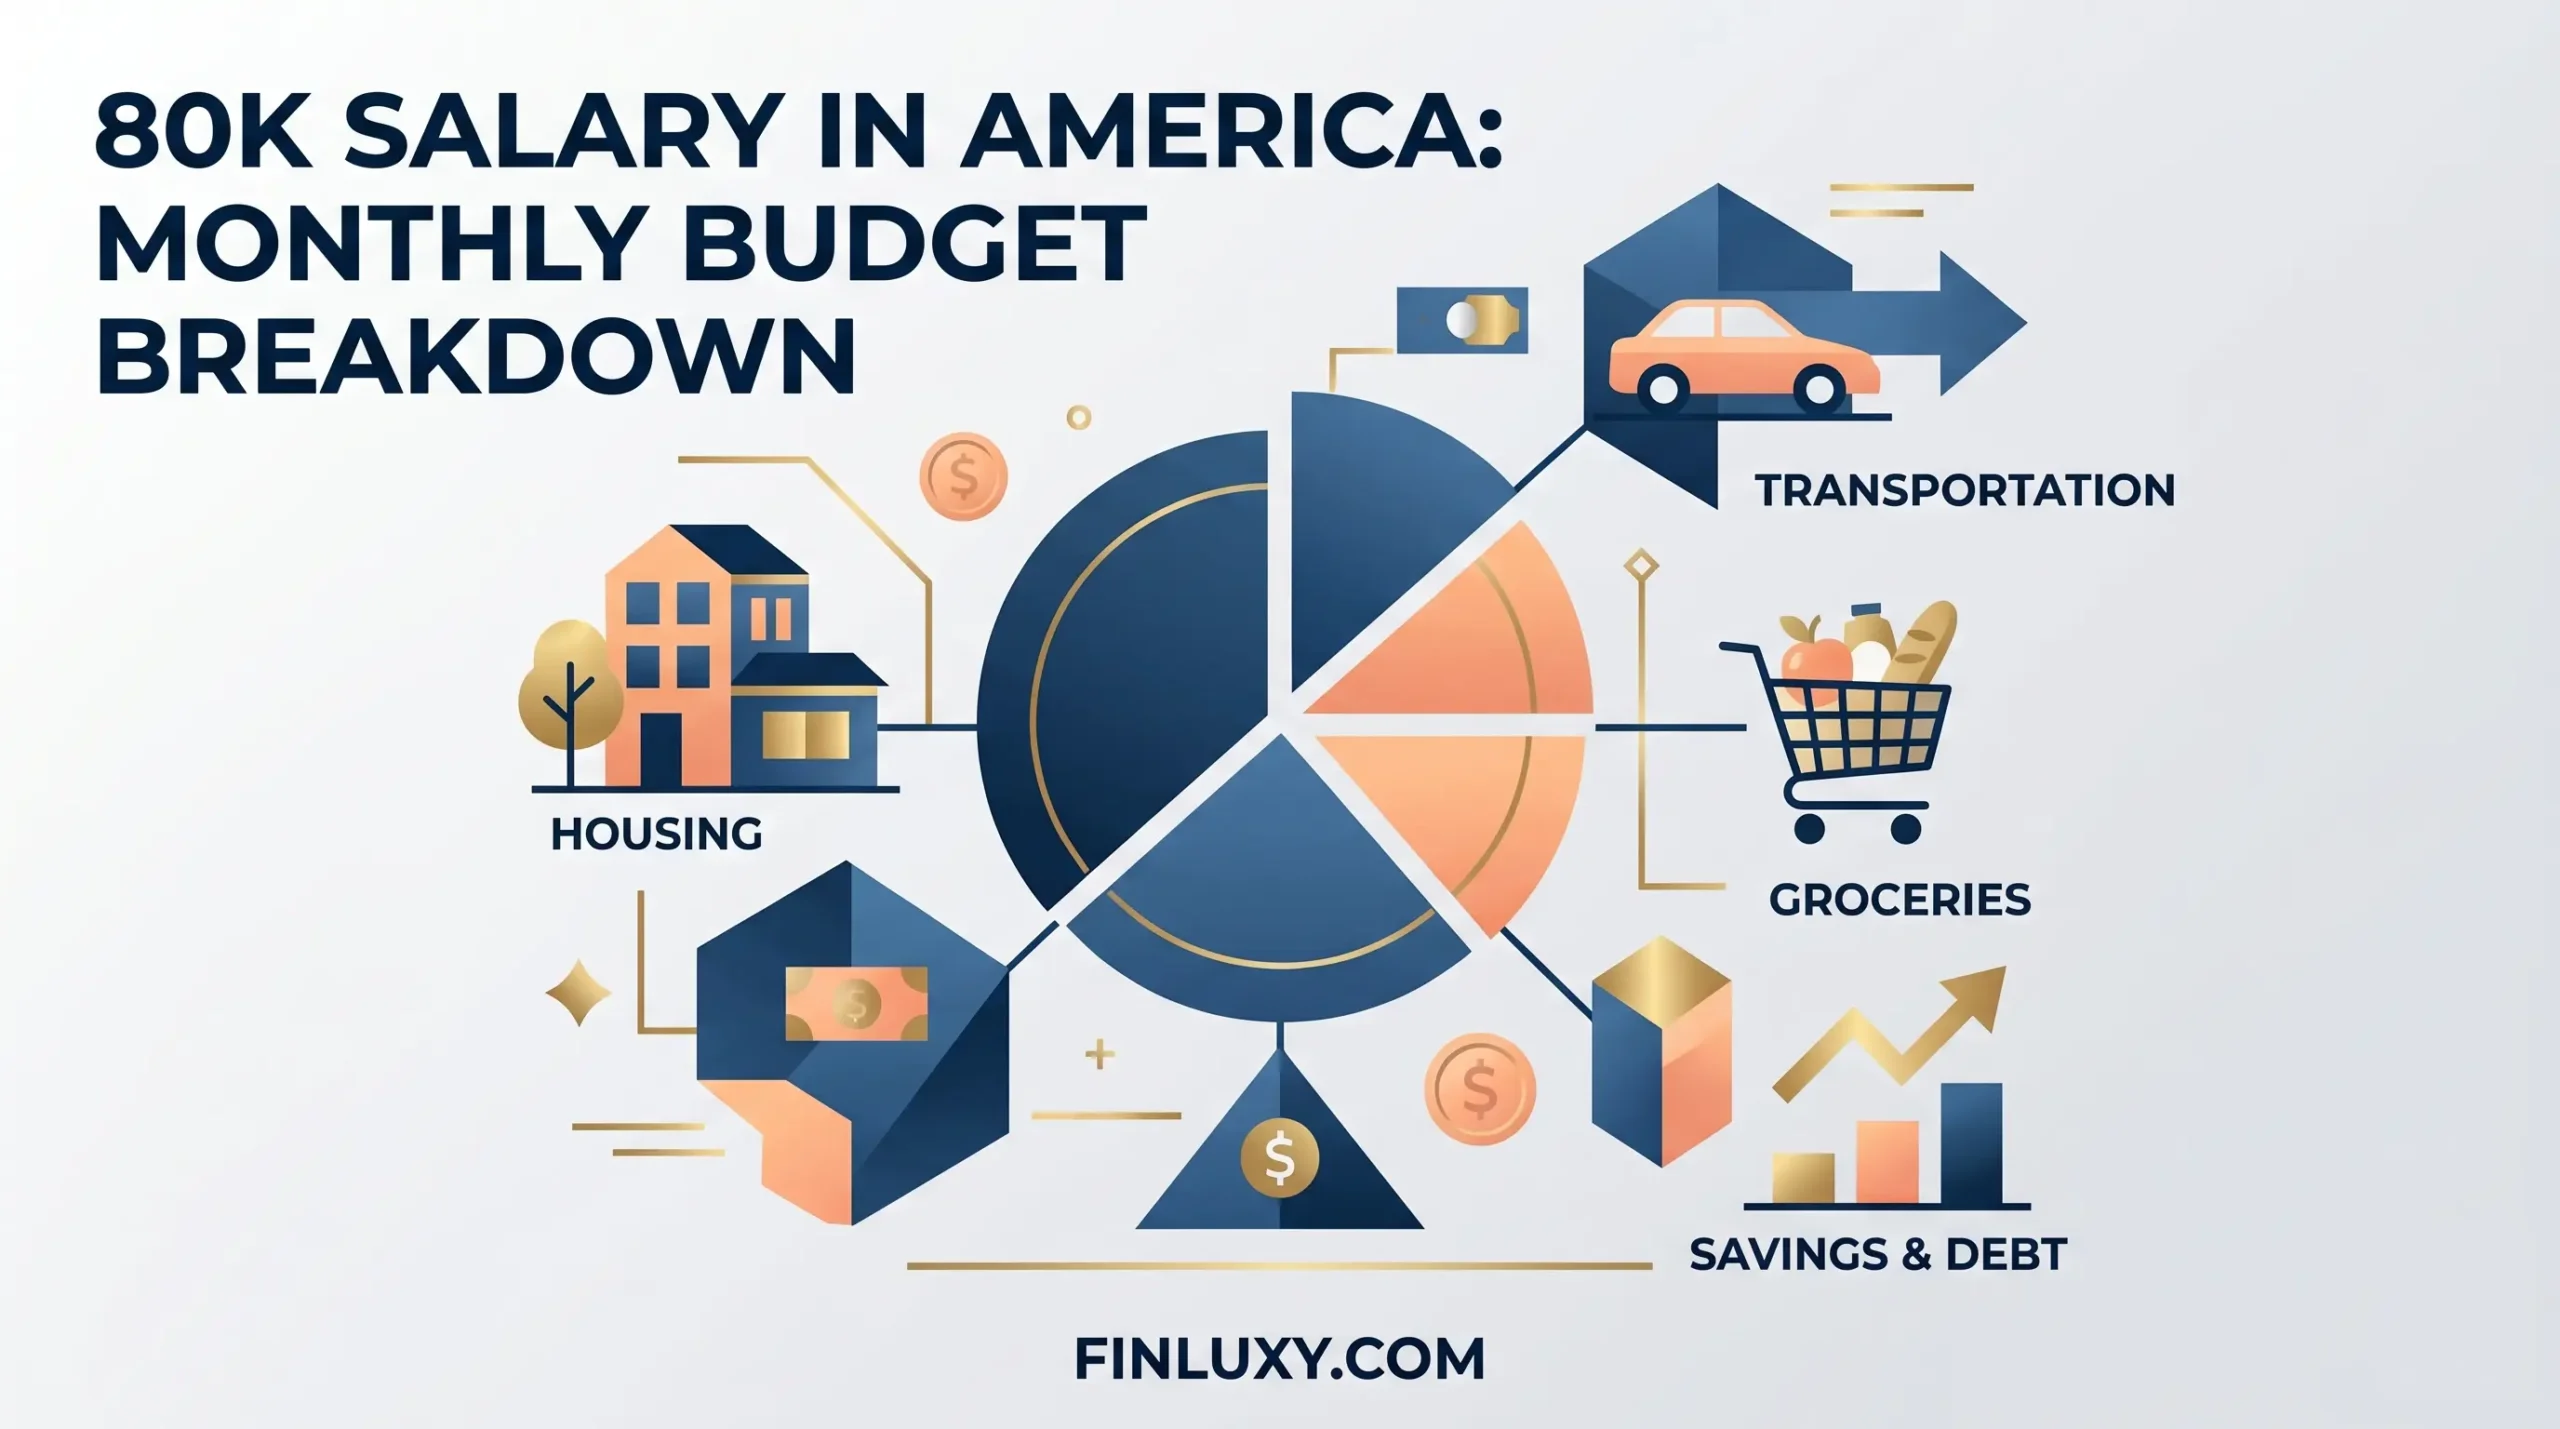
Geometric vector illustration of a budget pie chart with financial category icons, article headline text, and Finluxy.com at the bottom.

$80k Salary in America: Monthly Budget Breakdown

  • About
  • Privacy Policy
  • Editorial Policy
  • Disclaimer
  • Affiliate Disclosure
  • Terms of Use
  • Contact
© 2026 Finluxy. All Rights Reserved.