Skip to content
Finluxy
Finluxy
  • Affluent Living
  • Income Reality
  • Life & Money
  • Luxury Spending
  • Real Estate
  • Smart Spending
  • Tax & Wealth

Take-Home Pay

Gross salary is the number that appears in offer letters and headlines. Take-home pay is the number that determines what you can actually spend, save, and invest. For high earners, the gap between these two figures is substantial — and it varies dramatically based on state of residence, filing status, retirement contributions, and other factors. Building accurate take-home estimates is foundational to any financial planning that actually works.

A single filer earning $200,000 in W-2 income in California pays approximately: $35,000 in federal income tax (after standard deduction), $9,114 in Social Security tax (on the first $168,600), $2,900 in Medicare tax, and $16,000 in California state income tax — totaling roughly $63,000 in taxes, for a take-home of approximately $137,000, or 68.5% of gross. The same income in Texas (no state income tax) produces take-home of roughly $153,000, or 76.5% of gross. The $16,000 difference represents the value of Texas domicile for this income level.

At $500,000 W-2 income in California, the tax picture sharpens considerably. Federal income tax (after standard deduction): approximately $148,000. Medicare tax (including 0.9% additional): $8,350. Social Security tax: $10,453 (capped). California income tax: approximately $52,000. Total tax burden: approximately $219,000. Take-home: approximately $281,000, or 56.2% of gross. The effective take-home percentage drops significantly as income rises, reflecting the progressive rate structure and the Additional Medicare Tax trigger.

Pre-tax retirement contributions change the calculation materially. A $500,000 earner who maximizes 401(k) contributions ($23,000) reduces taxable income by that amount at the marginal rate (37% federal + 13.3% California = 50.3% combined), generating approximately $11,600 in immediate tax savings per year. The full analysis of how retirement contributions reduce take-home in year one while building long-term wealth is in retirement accounts. The Tax & Wealth pillar covers take-home pay alongside income tax, state taxes, and the other components of high-income financial planning.


Geometric vector illustration comparing salary stacks with a downward tax arrow, featuring clean composition and the headline "How Close Is $100k to $150k After All Taxes?".

How Close Is $100k to $150k After All Taxes?

Geometric vector illustration of a stylized figure stepping from a 22% tax bracket block to a higher 24% bracket block.

Crossing the 22% to 24% Bracket: What It Actually Costs

Geometric vector illustration about 401k pre-tax impacts, featuring modern abstract financial shapes, arrows, and the headline "Pre-Tax 401k Impact on $100k Gross: Monthly Change".

Pre-Tax 401k Impact on $100k Gross: Monthly Change

Geometric vector illustration comparing a W-2 salary worker and a 1099 freelancer, with the headline "$90k W-2 vs $90k 1099".

$90k W-2 vs $90k 1099: Which Nets More After Tax

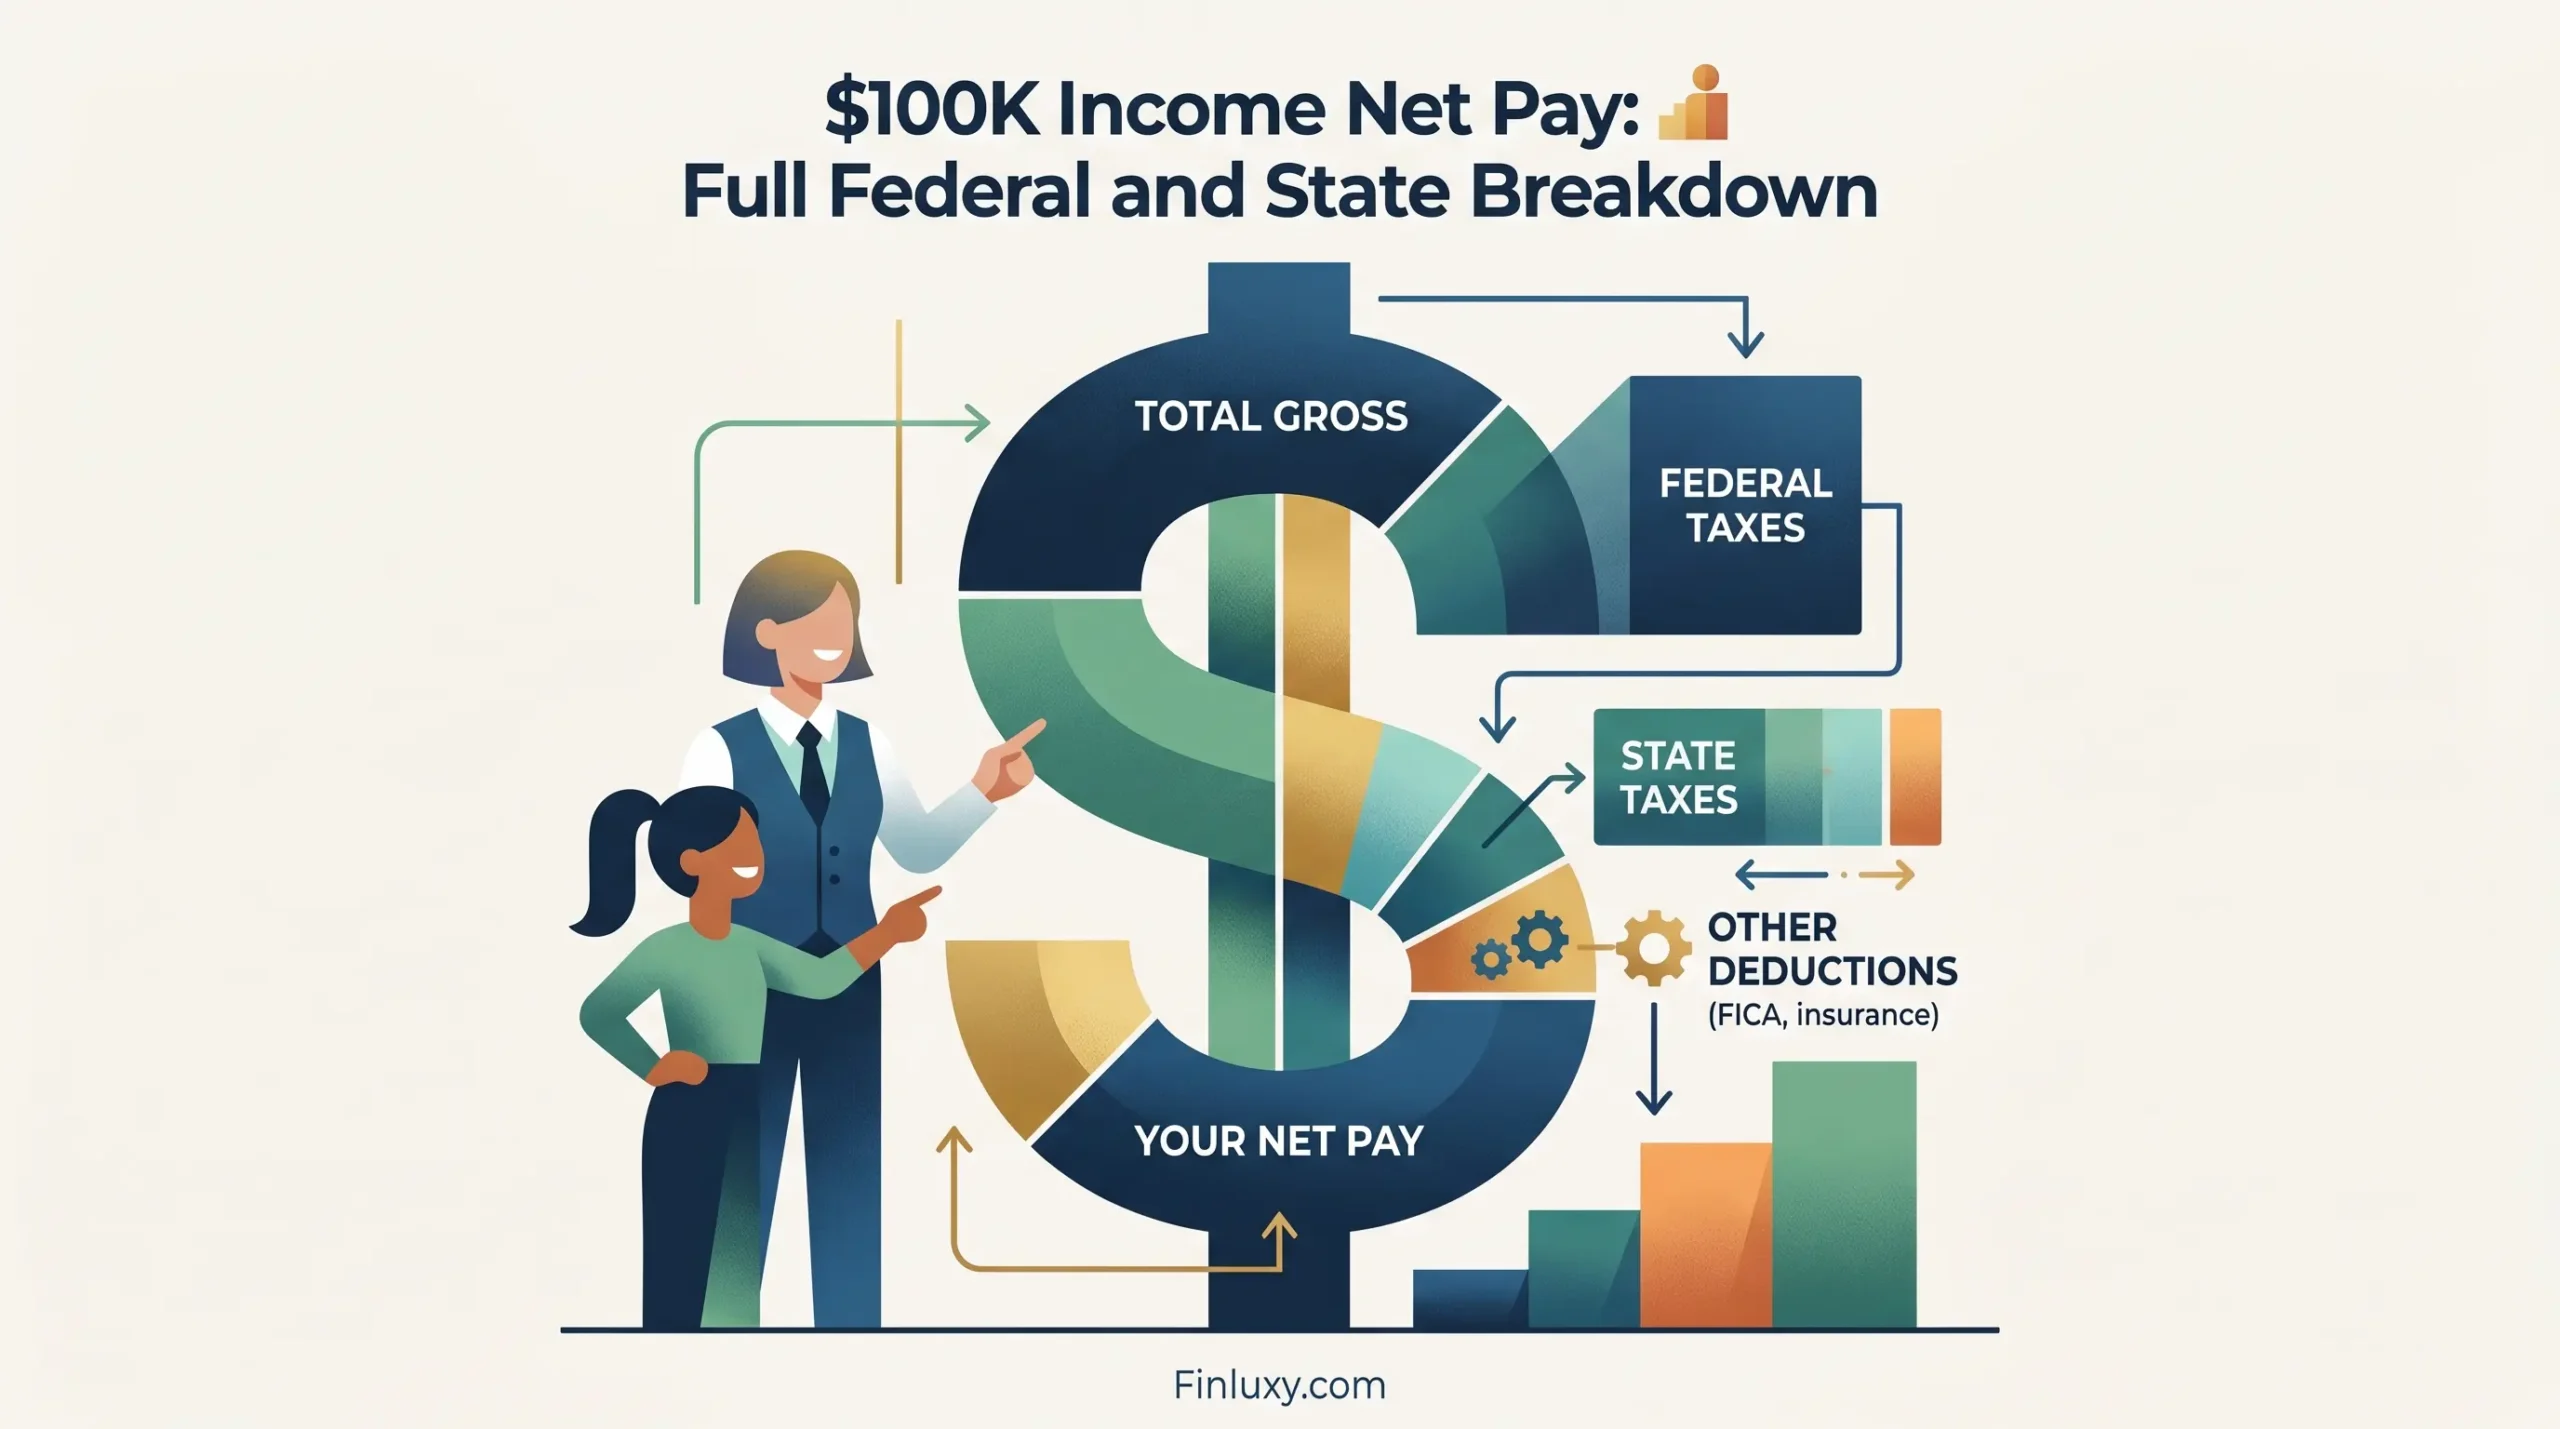
Vector illustration of income breakdown. Arrows and segments show deductions from total gross pay to federal, state, and other taxes. Two figures stand nearby.

$100k Income Net Pay: Full Federal and State Breakdown

Minimalist vector graphic of a person using a calculator next to US map shapes, featuring text "$80k Salary Take-Home Pay by State".

$80k Salary Take-Home Pay by State (2026 Data)

Geometric vector illustration of rising arrows and financial blocks, featuring the headline "A $10K Raise From $90K".

A $10k Raise From $90k: Real Monthly Take-Home Gain

A modern geometric illustration of a couple standing before a large safe and rising financial blocks, symbolizing shared household wealth.

$120k Household Take-Home: Married Filing Jointly

A modern vector illustration comparing take-home pay on a 200k gross salary between California and Texas for Finluxy.com.

California $200k Take-Home vs Texas $200k

An infographic for Finluxy.com showing how pre-tax benefits lower taxable income and result in higher monthly pay.

How Pre-Tax Benefits Increase Your Monthly Pay

Geometric vector illustration comparing the financial paths of a married couple and a single person with a $300k income.

$300k Household Take-Home: Married vs Single

A geometric diagram illustrating how 401k and HSA contributions are deducted from gross income to determine monthly net pay.

401k and HSA Impact on Monthly Net Pay

A stylized geometric flowchart illustrating gross income splitting into various expense categories like taxes, savings, and housing.

Paycheck Breakdown: Where $10k Gross Goes

A geometric vector illustration featuring stacked blue and green blocks and arrows pointing upwards, illustrating financial growth.

Marginal Dollar at $250k: What Each Extra $1k Yields

A geometric vector illustration showing the transformation of gross pay to net pay with icons for deductions.

Take-Home Pay Guide: Gross to Net at $150k to $500k

Minimal vector illustration of a gold coin divided into segments, representing net income after high-bracket tax deductions.

Bonus Take-Home at 37% Bracket: Real Net

Geometric vector map of the United States featuring minimal illustrations of cash stacks, representing income and salary variations by state.

$150k Salary Take-Home by State (2026 Data)

Geometric illustration showing a stack of money with a tax block on top against the New York City skyline.

NYC Take-Home Pay: City Tax Layer on Top

Geometric illustration showing a large dollar sign and a funnel reducing incoming funds into a smaller pile.

$200k Income Net Pay: What You Actually Keep

Side-by-side geometric illustration comparing a W-2 employee's secure benefits against a 1099 contractor's diverse self-employment income.

W-2 Employee vs 1099 Contractor: Net Pay Compared

  • About
  • Privacy Policy
  • Editorial Policy
  • Disclaimer
  • Affiliate Disclosure
  • Terms of Use
  • Contact
© 2026 Finluxy. All Rights Reserved.