 Analysis by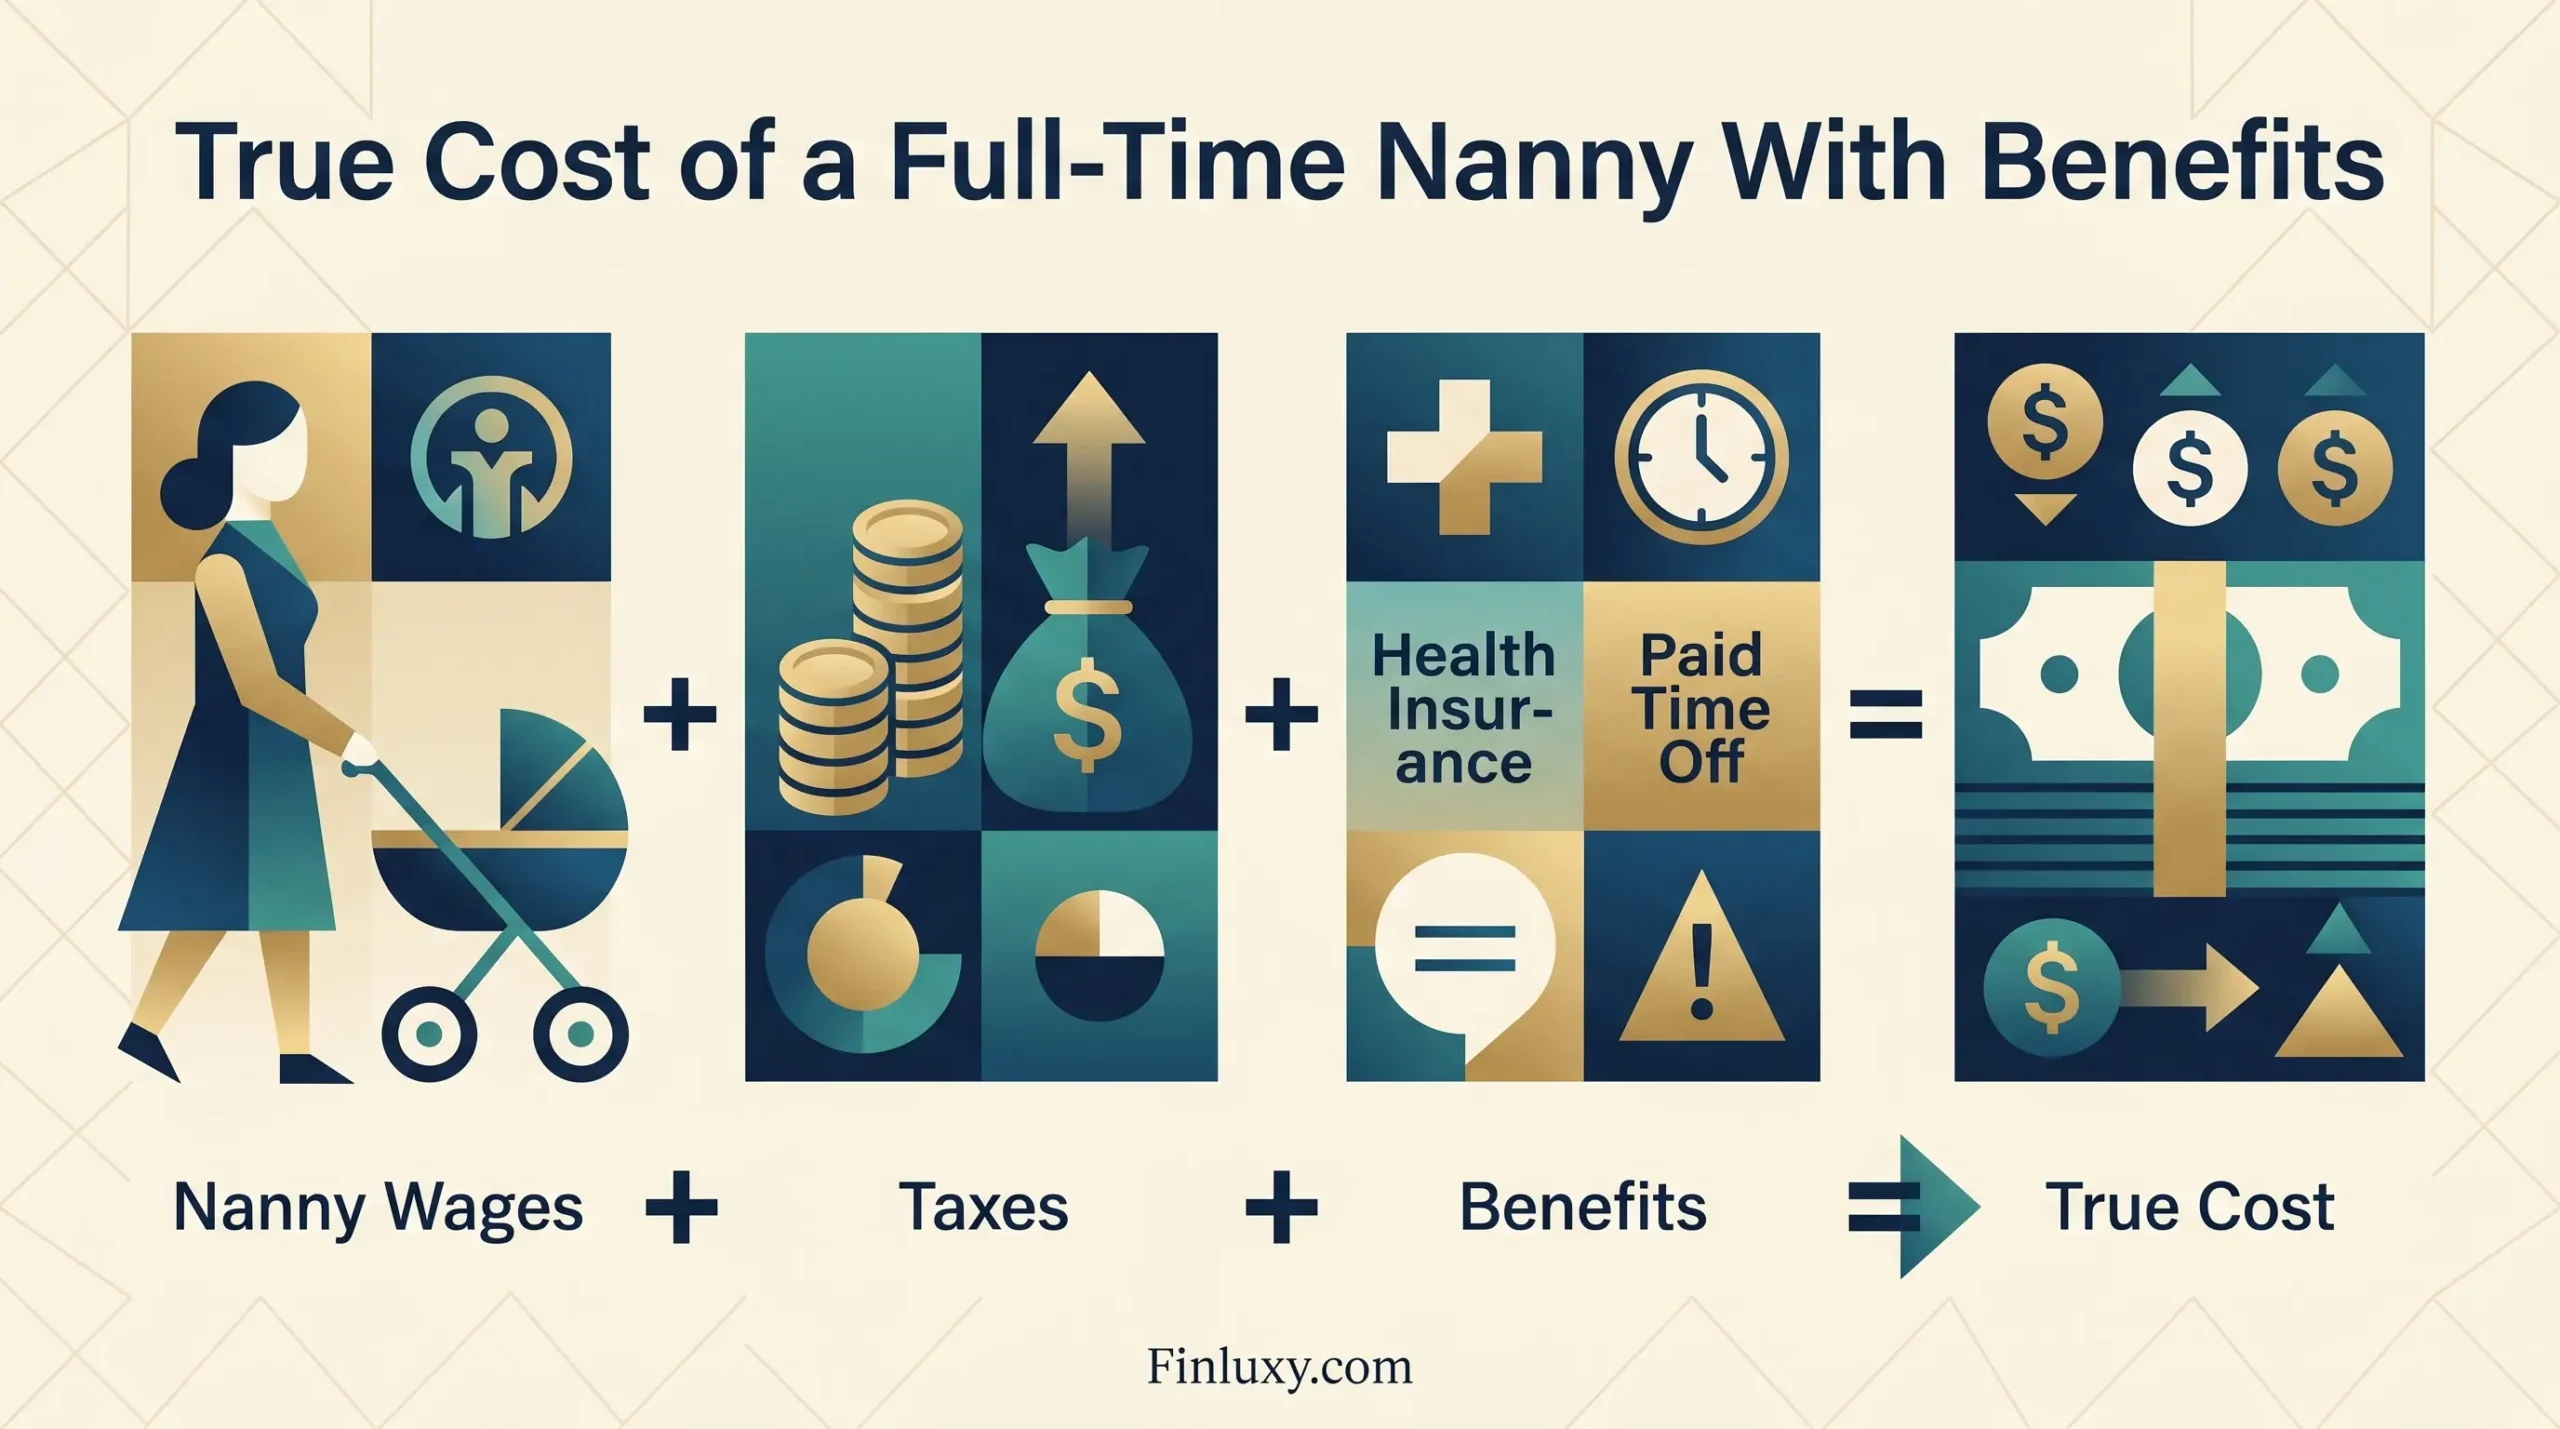
The posted salary on a nanny job listing is not what you will pay. For a household employer in a major metro area, the true all-in annual cost of a full-time nanny with a standard benefits package runs $65,000 to $95,000 or more — 25% to 40% above the gross wage figure most families anchor to. Federal Insurance Contributions Act (FICA) employer taxes, workers’ compensation insurance, paid time off, and agency placement fees amortize into a cost structure closer to what you’d pay a mid-level corporate employee than the hourly rate that shows up in job postings.
This analysis models the total annual cost of a full-time live-out nanny with a standard benefits package for a household employer in the continental United States. Figures reflect 2026 federal tax law (IRS Publication 926, current revision) and 2025–2026 market rate data from Care.com and the International Nanny Association (INA). State-level taxes, mandatory disability insurance programs (applicable in California, Hawaii, New Jersey, New York, and Rhode Island), and city-specific wage ordinances are not modeled in the base scenario — they will increase costs further. This is cost analysis, not tax or legal advice. Salary ranges reflect posted market rates and will vary by metropolitan area, nanny experience, and scope of duties.
Key Numbers at a Glance
| Cost Component | Annual Amount | Notes |
|---|---|---|
| Gross salary | $65,000 | ~$31.25/hr × 40 hrs × 50 weeks; upper-mid metro range |
| Employer FICA (7.65%) | $4,973 | IRS Publication 926, 2026 |
| FUTA (effective 0.6% on first $7,000) | $42 | Assumes timely state UI payment; CA/VI higher |
| Workers’ compensation insurance | $550 | Midpoint of $300–$800 standalone policy range |
| Paid time off value (2 wks vacation + 5 sick days) | $3,750 | 15 days × $250/day implied daily rate |
| Paid federal holidays (10 days) | $2,500 | Industry standard; 10 days × $250/day |
| Health insurance contribution | $3,600 | Modest stipend; full coverage would add $6,000–$9,000 |
| Year-end bonus (industry norm) | $1,951 | INA 2023 Salary and Benefits Survey median |
| Agency placement fee (amortized over 2 years) | $4,875 | 15% of $65,000 = $9,750 ÷ 2 |
| Total All-In Annual Cost | $87,241 | Before state UI tax and state-mandated disability insurance |
Sources: IRS Publication 926 (2026 revision); Care.com 2025 Cost of Care Survey; INA 2022 and 2023 Salary and Benefits Surveys; Insurify (2026) for workers’ comp range; Hand In Hand Domestic Employers for PTO standards.
The Gross Salary: What the Market Actually Looks Like
According to the Care.com 2025 Cost of Care Survey — which surveyed 3,000 parents nationally — families posted nanny rates averaging $870 per week ($21.75/hour) for one child on a 40-hour schedule. That translates to roughly $43,000 annually at the national average. But that number describes the median of all postings, including rural markets and less-experienced candidates.
For $150k+ households in competitive metros — New York, Los Angeles, Boston, Seattle, Washington D.C. — the realistic salary range for an experienced, credentialed full-time nanny runs $55,000 to $85,000 gross. Care.com’s own calculator shows posted rates of $26.14/hour in Los Angeles. The INA’s 2022 Salary and Benefits Survey, the most recent available, put the national median nanny hourly rate at $25/hour — up from $19/hour in 2017, a 32% increase in five years. At $25/hour on a 50-week, 45-hour schedule, gross wages already reach $56,250 before a single employer obligation is added.
Experience compounds the premium. The INA data shows nannies with 4–6 years of experience command roughly $2/hour more than those with 1–3 years; those with 7–10 years add another dollar per hour on top of that. Additional duties — light housekeeping, meal prep, school runs, a second child — each push rates higher. The $65,000 gross salary used in this model sits at the lower end of what a competent, experienced nanny in a major metro would realistically accept. For a genuinely elite hire, model $75,000–$85,000. For details on how nanny rates vary across specific markets, see the childcare cost breakdown for New York, LA, and Chicago.
Employer Tax Obligations: The Nanny Tax in 2026
The informal term “nanny tax” refers to the federal employment taxes a household employer must pay when cash wages to any one household employee reach $3,000 or more in a calendar year — the 2026 threshold per IRS Publication 926. The FICA employer share is 7.65% of gross wages: 6.2% for Social Security (on wages up to the 2026 wage base of $184,500) and 1.45% for Medicare with no cap. On a $65,000 salary, that is $4,973 out-of-pocket for the employer — an obligation that appears nowhere in the job posting and surprises a meaningful number of first-time household employers.
FUTA, the federal unemployment tax, carries a gross rate of 6% but drops to an effective 0.6% once you receive the full 5.4% credit for paying state unemployment insurance on time. Applied to the first $7,000 of wages, the maximum federal FUTA liability is $42 per employee per year. State unemployment insurance (SUTA) adds another 1–5% depending on jurisdiction and employer experience rating. Employers in California face a higher effective FUTA rate in 2026 due to outstanding federal loan balances — a factor that the national average FUTA figure does not capture. For a comprehensive breakdown of these payroll obligations, the nanny payroll tax guide covers each line item with state-level variation.
Household employers file Schedule H with their Form 1040 to report these taxes. The employer does not need to make quarterly deposits if total household employment taxes remain below $1,000 — but on a $65,000 salary, that threshold is crossed in the first quarter. A Form W-2 is required for any household employee paid $3,000 or more in 2026, and failure to issue one carries penalties. The payroll administration burden alone is a reason many families use a household payroll service, which typically costs $800–$1,500 annually — a line item not included in this model’s base figures but worth adding to the analysis.
Benefits: Where the Real Gap Between Gross Salary and True Cost Opens Up
Market norms for a professional full-time nanny have converged around a standard benefit floor: two weeks of paid vacation, five paid sick days, and ten paid federal holidays. Industry resources including Hand In Hand Domestic Employers and Care.com consistently cite this package as the baseline expectation; the INA’s data confirms it is standard practice. At a $65,000 gross salary, that PTO structure costs roughly $3,750 for the two-week vacation plus five sick days (15 days × implied daily rate of $250), and another $2,500 for the ten federal holidays — a combined $6,250 in paid non-working time. The broader nanny cost guide for $150k+ households models how these benefit standards differ across experience tiers.
Health insurance sits in a different category. No law requires household employers to provide health coverage, but experienced candidates increasingly negotiate for it. A modest monthly stipend of $300 ($3,600 annually) signals professionalism without requiring the employer to administer a group plan. Full ACA-compliant individual coverage in many metro markets costs $500–$750/month for a 30-something adult — a $6,000–$9,000 annual commitment. This analysis uses the $3,600 stipend figure; families offering full coverage should add $2,400–$5,400 to the total.
Year-end bonuses have become a near-universal expectation. The INA’s 2023 Salary and Benefits Survey found that nearly 75% of nannies receive a year-end bonus, with a median amount of $1,951. This is not optional in practice — declining to offer one after the first year is interpreted as a signal of dissatisfaction and accelerates turnover. A replacement search costs 15% of annual salary in agency fees and 4–8 weeks of disrupted care schedules. The bonus is cheap retention insurance.
Other benefits commonly negotiated in competitive markets include mileage reimbursement at the IRS standard rate (67 cents/mile for 2024, adjusted annually) when the nanny uses her personal vehicle for family errands, professional development allowances of $200–$500/year for CPR recertification or early childhood education courses, and a cell phone stipend of $50–$100/month. This analysis excludes mileage and professional development from the base scenario, but a family with regular transportation needs should budget an additional $1,200–$3,600/year depending on usage.
Agency Placement Fees: A One-Time Cost That Recurs More Often Than Expected
According to the International Nanny Association, nanny agency placement fees range from $800 to $10,000 depending on agency tier, nanny experience, and role type (live-in commands higher fees than live-out). Most agencies price as a percentage of annual gross salary, with the industry range sitting at 10–20%. Premium agencies in major metros cluster at 15–20%. At 15% of a $65,000 salary, the placement fee is $9,750 — a one-time charge payable upon hire, before the nanny works a single day.
Amortized over a two-year retention horizon, that fee adds $4,875 to the annual cost. Amortized over one year — the actual average tenure for many nanny placements — it adds $9,750. Nanny turnover is a meaningful financial risk. Industry observers note that nannies in competitive markets frequently receive competing offers, and families who pay below-market salaries or skimp on benefits tend to lose candidates to higher-paying households within 12–18 months. For a detailed look at what drives the fee structure, see the analysis of nanny agency placement fees.
Finluxy Childcare True Cost Rate: Three Scenarios
The Finluxy Childcare True Cost Rate converts the total all-in annual cost into a per-hour figure, making it comparable across care types and against published market wage data. The formula: total all-in annual cost ÷ total annual care hours = $/hour.
| Scenario | Gross Salary | Total All-In Annual Cost | Annual Care Hours | Finluxy Childcare True Cost Rate | vs. Care.com Posted Rate ($21.75/hr) |
|---|---|---|---|---|---|
| National average market | $45,000 | $62,490 | 2,000 hrs (50 wks × 40 hrs) | $31.25/hour | +44% above posted rate |
| Major metro, mid-range hire | $65,000 | $87,241 | 2,250 hrs (50 wks × 45 hrs) | $38.77/hour | +78% above posted rate |
| Major metro, senior hire | $85,000 | $113,185 | 2,250 hrs (50 wks × 45 hrs) | $50.30/hour | +131% above posted rate |
Finluxy calculations. Salary anchors from Care.com 2025 Cost of Care Survey and INA 2022 Salary and Benefits Survey. Tax figures per IRS Publication 926, 2026 revision. Benefits modeled as: employer FICA 7.65%; FUTA $42; workers’ comp $550; 15 PTO days at implied daily rate; 10 paid holidays at implied daily rate; $3,600 health stipend; $1,951 year-end bonus (INA 2023); agency fee at 15% of gross amortized over 2 years. Senior-hire scenario uses 18% agency fee. Note: State UI taxes and state-mandated disability insurance excluded; inclusion adds $300–$1,500+ depending on state and salary level.
The gap between the Finluxy Childcare True Cost Rate and the Care.com posted hourly rate is the central finding of this analysis. At the national average salary, the posted rate understates employer cost by 44%. At the senior metro level, it understates by 131%. The posted rate is what a nanny receives; the Finluxy Childcare True Cost Rate is what an employer actually pays per hour of care provided. No other widely cited benchmark closes this gap, which is why household budgets built on posted rates routinely undershoot actual expenditures.
The Tax Offset: Dependent Care FSA and the Child and Dependent Care Credit
Two federal mechanisms reduce the after-tax cost of nanny employment, and the 2026 numbers are meaningfully better than they were in 2025. The Dependent Care FSA limit rose from $5,000 to $7,500 per household for the 2026 tax year, effective January 1, 2026, as part of the One Big Beautiful Bill Act — a change confirmed in IRS Publication 15-B (2026 revision). For a household employer in the 32% federal bracket, the full $7,500 Dependent Care FSA contribution produces a tax saving of approximately $2,400. For couples filing jointly in the 35% bracket, savings reach $2,625. For married individuals filing separately, the limit is $3,750.
The Child and Dependent Care Credit provides a separate offset — calculated on Form 2441 based on up to $3,000 of qualifying expenses for one child, with a credit rate that phases down from 35% to 20% as adjusted gross income rises. At the income levels typical of $150k+ households, the effective credit rate is 20%, yielding a maximum credit of $600 for one child. The Dependent Care FSA and the Child and Dependent Care Credit cannot be applied to the same dollars — FSA contributions reduce the expense base available for the credit calculation. For an in-depth look at the mechanics, the Dependent Care FSA savings analysis models the combined offset at different income brackets. The childcare tax credit breakdown covers Form 2441 mechanics in detail.
Combined, a $150k+ household can realistically offset $3,000–$3,225 of annual nanny cost through these two mechanisms — meaningful, but modest against a $87,000+ annual obligation. The after-tax cost remains substantially above what most families model when they first budget for nanny care.
The Overlooked Cost: What Most Coverage Misses
Nearly every nanny cost article leads with gross salary and adds employer FICA. Very few account for the compounding effect of turnover risk on amortized placement fees. The standard two-year amortization assumption flatters the math. Data on nanny tenure is sparse — the INA does not publish comprehensive retention statistics — but household employment payroll services and placement agencies consistently report that placements in markets with high childcare demand (New York, San Francisco, Los Angeles) turn over faster than the national norm. A family that experiences two nanny transitions in three years will pay placement fees roughly equivalent to one additional month of gross salary per year, not the half-month implied by two-year amortization. That alone shifts the Finluxy Childcare True Cost Rate by $0.50–$1.50/hour.
The second underappreciated cost is the employer’s time. Running compliant household payroll — quarterly FUTA deposits where required, annual Schedule H, state UI filings, W-2 issuance — takes 10–20 hours per year for a family handling it independently. At an opportunity cost of $150–$300/hour for a $150k+ earner, that is $1,500–$6,000 of implicit annual cost. Outsourcing to a household payroll service costs $800–$1,500/year and eliminates the compliance risk. Either way, it is a real cost that does not appear in any published nanny rate comparison.
How Nanny Cost Compares to Alternatives
| Care Type | Annual Cost Range | Care Hours (Typical) | Approximate True Cost Rate |
|---|---|---|---|
| Full-time nanny, solo hire (with benefits) | $62,000–$113,000+ | 2,000–2,250 hrs/year | $31–$50+/hr |
| Nanny share (two-family split) | $38,000–$65,000 | 2,000–2,250 hrs/year | $19–$29/hr |
| Au pair (State Dept. program) | $22,000–$32,000 | 2,000–2,500 hrs/year | $9–$16/hr |
| Luxury daycare center | $28,000–$55,000 | 2,200–2,500 hrs/year | $11–$25/hr |
Nanny ranges: Care.com 2025 Cost of Care Survey; Finluxy TCO model. Au pair range: U.S. Department of State program fee data and agency estimates. Daycare: Care.com 2025 Cost of Care Survey. All ranges are national; major metro costs skew toward upper bounds. Au pair cost reflects all-in program costs; effective hourly rate is low due to program-mandated hour caps and room/board offset.
The au pair program produces the lowest effective hourly rate — but at the cost of hosting a live-in participant, which requires dedicated private accommodation and carries a different set of household obligations. Nanny share arrangements cut per-family cost by 30–40% at the expense of one-on-one attention. For families with two children, the cost calculus of a solo nanny versus a daycare center over five years shifts dramatically as a second child enters the picture — a solo nanny’s cost stays flat while daycare tuition doubles. The comparison of childcare cost against a second income is particularly relevant for dual-earner households contemplating whether a second salary nets positive after care costs.
Context for the $150k+ Household
At $87,241 all-in for the mid-range scenario, a full-time nanny with benefits consumes approximately 17% of a $500,000 household gross income — and a more punishing 29% of a $300,000 gross income before federal and state taxes are applied to take-home pay. For the household with a primary earner at $200,000 and a secondary earner at $80,000, the nanny’s true cost against the secondary income after federal and state taxes on that $80,000 is striking: in a high-tax state, the secondary earner may net $48,000–$55,000 after income taxes, putting nanny cost at 60–80% of that take-home. The decision framing for many $150k+ dual-income households is not really whether they can afford the nanny — they can write the check — but whether the second income relationship makes financial sense after nanny costs.
The 2026 Dependent Care FSA increase to $7,500 is the most significant change for household employers in recent years and should be factored into benefit-period planning immediately. Families whose employers offer FSA elections should verify they have updated their contribution to the new $7,500 limit — the prior $5,000 limit meant leaving roughly $625–$875 in annual tax savings on the table at the income levels this analysis targets. Separately, households facing a live-in arrangement should review the true cost analysis of live-in nanny room and board, which introduces FMV lodging calculations and additional IRS rules. For families weighing whether a nanny share makes more sense at their specific income level, the nanny share viability analysis at various household income levels and the childcare cost vs. a $70k salary breakdown provide useful reference points. Building a realistic childcare budget means starting with the Finluxy Childcare True Cost Rate, not the posted hourly wage.
Frequently Asked Questions
What is the nanny tax threshold in 2026?
The 2026 FICA threshold is $3,000 in cash wages paid to any single household employee during the calendar year, per IRS Publication 926 (2026 revision). Once that threshold is crossed, the household employer owes the employer’s share of FICA — 7.65% of total gross wages — plus must withhold the employee’s matching 7.65%. The 2026 threshold increased from $2,800 in 2025 and $2,700 in 2024. Any household employee earning above $3,000 annually must receive a Form W-2 by January 31 of the following year.
How much does the Dependent Care FSA save a $150k+ household in 2026?
The 2026 Dependent Care FSA limit is $7,500 per household for couples filing jointly, up from $5,000 in 2025. The tax savings depend on your marginal federal rate. At the 32% bracket, the full $7,500 contribution saves approximately $2,400 in federal income taxes. At 35%, savings are approximately $2,625. State income tax savings add further value in states with income taxes. Note that FSA contributions reduce the expense base available for the Child and Dependent Care Credit (Form 2441), so you cannot capture both benefits on the same dollars.
Is workers’ compensation insurance required for nannies?
Requirements vary by state. At least 15 states mandate workers’ compensation coverage for household employees, including California, New York, Illinois, Massachusetts, and Washington. In states where coverage is not legally required, carrying a policy is still prudent — a single on-the-job injury can expose the household employer to uncapped medical and wage liability. Standalone policies typically cost $300–$800 per year depending on the nanny’s wages and the state, per Insurify (2026) and Beverly.io (2026) data. Some homeowners’ insurance policies offer a domestic worker endorsement at a lower cost but with more limited coverage.
What benefits are standard for a full-time nanny in 2026?
Industry standard, as cited consistently by Care.com, Hand In Hand Domestic Employers, and placement agencies, is two weeks of paid vacation, five paid sick days, and ten paid federal holidays. Many experienced nannies also negotiate a health insurance contribution or stipend ($200–$750/month is the market range), a year-end bonus (median $1,951 per INA 2023 data), and mileage reimbursement at the IRS standard rate when using a personal vehicle for family business. In competitive markets, failing to offer the standard PTO package makes a posting significantly less attractive to experienced candidates.
How does the Finluxy Childcare True Cost Rate differ from a nanny’s hourly rate?
The Finluxy Childcare True Cost Rate is total all-in annual employer cost — including gross salary, all employer taxes, workers’ compensation, the value of paid time off and holidays, health contributions, year-end bonus, and amortized agency placement fees — divided by actual annual hours of care provided. The posted hourly rate reflects only the nanny’s gross wage. For the mid-range metro scenario modeled here ($65,000 gross salary), the posted rate is approximately $31.25/hour while the Finluxy Childcare True Cost Rate is $38.77/hour — a 24% gap on a per-hour basis, and a 34% gap in total annual cost relative to gross salary alone.
Methodology
Tax figures in this analysis are drawn directly from IRS Publication 926 (2026 revision, current as of publication) and IRS Publication 15-B (2026 revision) for the Dependent Care FSA limit. The 2026 FICA threshold of $3,000 and the employer FICA rate of 7.65% are sourced from the IRS; the FUTA effective rate of 0.6% reflects the standard credit scenario for employers who pay state UI taxes on time. Market salary data draws on the Care.com 2025 Cost of Care Survey (3,000 parents surveyed, November 2025) and the INA 2022 Salary and Benefits Survey (most recent edition available). Agency placement fee ranges are from the International Nanny Association as cited by UrbanSitter, cross-referenced against multiple agency fee schedules. Workers’ compensation cost range ($300–$800) is sourced from Insurify (February 2026) and Beverly.io (February 2026); the $550 midpoint is used in the base model. PTO standards reflect Care.com guidance, Hand In Hand Domestic Employers standards, and placement agency contracts. The Finluxy Childcare True Cost Rate is a proprietary metric calculated as total all-in annual cost ÷ annual care hours; it is calculated for three salary scenarios and is not drawn from any external source. BLS May 2024 OEWS median hourly wage for childcare workers ($15.41) reflects workers in institutional settings and is not used for nanny salary benchmarking in this analysis, as BLS OEWS data explicitly excludes self-employed and household workers.
Sources & References
- IRS Publication 926 — Household Employer’s Tax Guide, 2026 revision
- IRS Publication 15-B — Employer’s Tax Guide to Fringe Benefits, 2026 revision (Dependent Care FSA limit)
- IRS Instructions for Schedule H (2025) — Household Employment Taxes
- Care.com — 2026 Cost of Care Report (survey conducted November 2025)
- Care.com — Nanny Pay Rates: How Much Should I Pay My Nanny? (updated February 2026)
- International Nanny Association — 2022 Salary and Benefits Survey Results
- Bureau of Labor Statistics — Childcare Workers Occupational Outlook Handbook (May 2024 wage data)
- UrbanSitter — Cost of Hiring Through a Nanny Agency (INA placement fee data, 2025)
- Insurify — Nanny Insurance: Cost and Coverage (February 2026)
- Beverly.io — Nanny Workers’ Comp by State (February 2026)
- Hand In Hand Domestic Employers — Paid Time Off for Nannies
- ERISA Practice Center — IRS Releases FSA Limits for 2026 (Dependent Care FSA legislative change)
- Nest Payroll — 2026 Nanny Tax Update: New Thresholds for Household Employers