 Analysis by
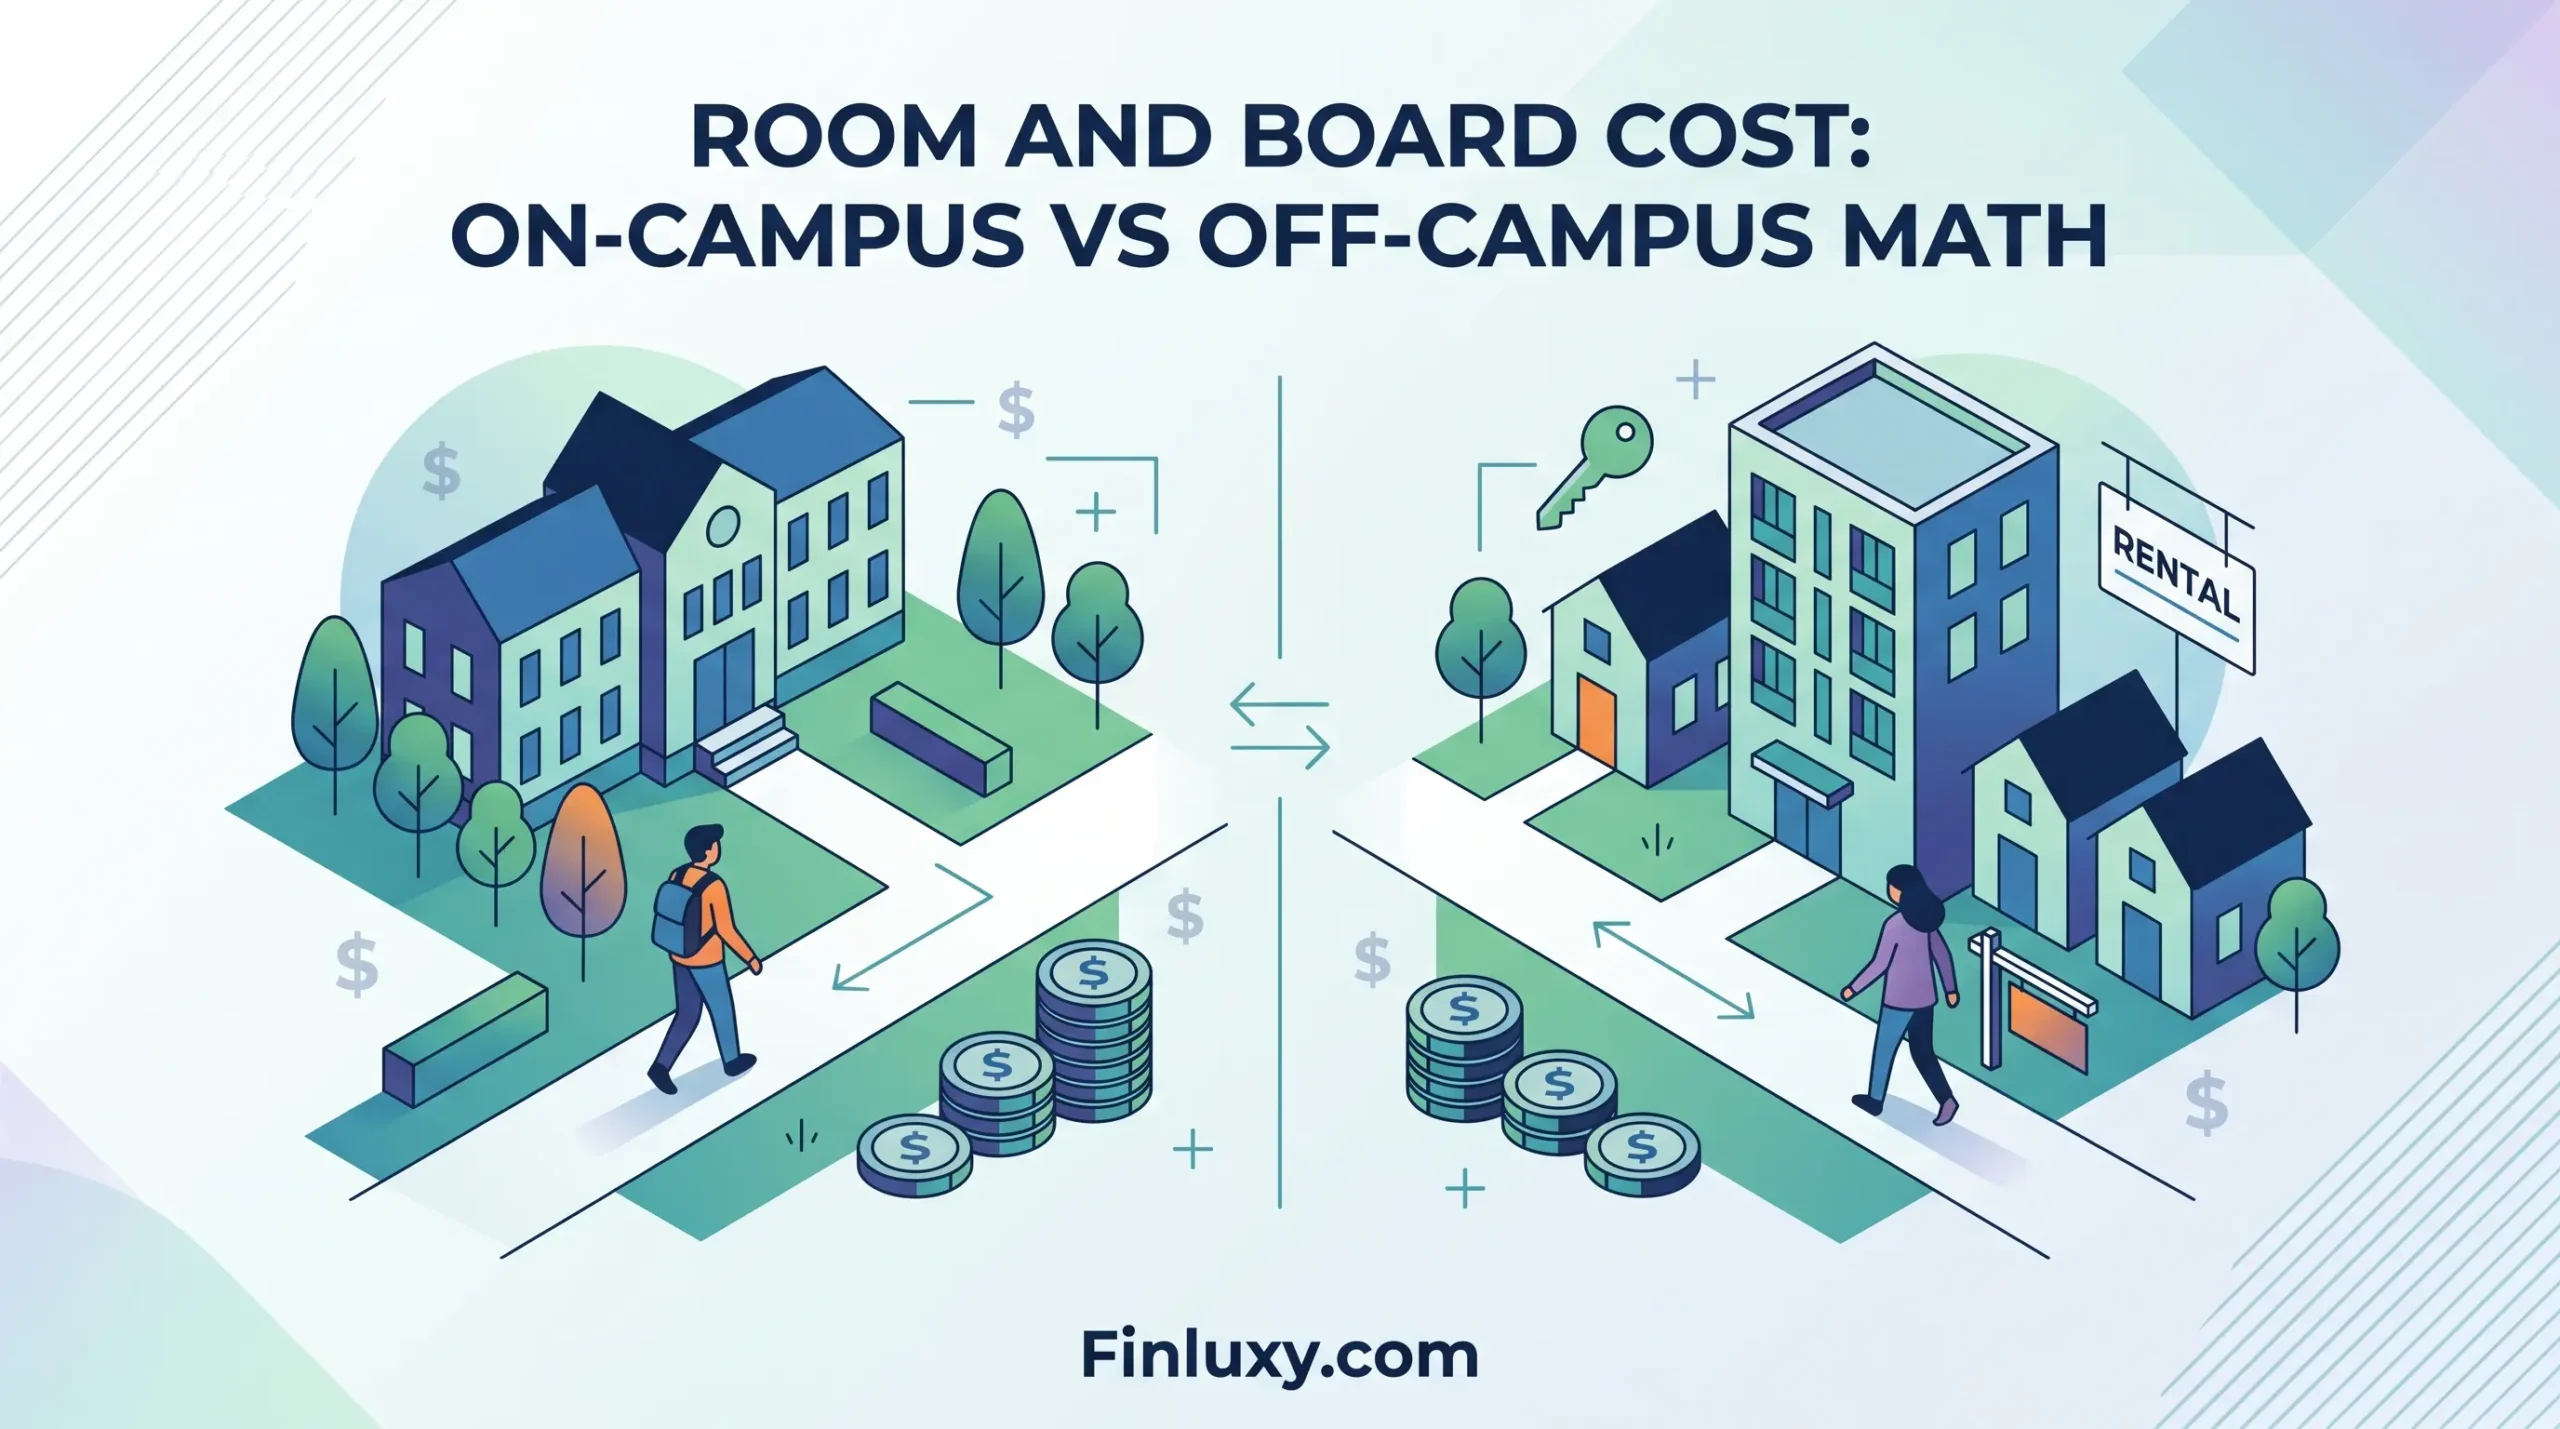
The average on-campus room and board bill runs $13,900 at public four-year universities and $15,920 at private nonprofits in 2025-26, according to the College Board’s Trends in College Pricing and Student Aid 2025. Those figures appear in every cost-of-attendance estimate your student receives — but they say almost nothing about whether off-campus housing will actually cost less.
The national average obscures a market reality that varies by $12,000 or more annually depending on where the school sits. A student sharing a three-bedroom apartment in Ann Arbor operates in a completely different financial universe than one doing the same in Boston or New York. Before a $150k+ household signs off on a housing decision, the math deserves a full breakdown — not just a rent comparison.
Scope and data limitations: On-campus figures are enrollment-weighted national averages from the College Board (2025-26 academic year) and NCES IPEDS (2023-24). Off-campus cost ranges are drawn from Education Data Initiative analysis of NCES IPEDS data, supplemented by market-level rental data for illustrative city comparisons. No single off-campus figure applies universally; local rental markets, roommate arrangements, and lease structures drive wide variation. Starting salary data used in the Finluxy College Investment Ratio is from the NACE Winter 2025 Salary Survey (Class of 2026 projections). This article presents cost data for informational purposes only and does not constitute financial advice.
Key Figures at a Glance
| Metric | Figure | Source |
|---|---|---|
| On-campus room and board — public 4-year | $13,900/year | College Board, Trends in College Pricing 2025 |
| On-campus room and board — private nonprofit 4-year | $15,920/year | College Board, Trends in College Pricing 2025 |
| Average on-campus housing (room only) — all 4-year | $8,196/year | Education Data Initiative, 2025-26 |
| Average on-campus meal plan — all 4-year | $6,205/year | Education Data Initiative, 2025-26 |
| Average off-campus housing and food (not with family) — all 4-year | $12,535/year | NCES IPEDS, 2023-24 |
Sources: College Board, Trends in College Pricing and Student Aid 2025 (November 2025); Education Data Initiative analysis of College Board and NCES data (2025-26); NCES IPEDS 2023-24 institutional data via College Raptor.
What the Sticker Price Actually Covers
On-campus room and board bundles several costs that become line items the moment a student moves off campus: the room itself, a mandatory meal plan, utilities (electricity, water, heat, internet), basic furnishings, and building maintenance. The $13,900 or $15,920 figure is all-in for what it covers — no surprise bills in February when the heating bill arrives.
Off-campus housing carries no such bundling. Rent is just rent. Students and parents separately absorb utilities ($100–$200 per month, depending on the market and how many roommates split the bill), renter’s insurance ($15–$30 per month), a security deposit equal to one month’s rent due upfront, and first-year furniture costs ranging from $500 to $1,500, according to cost breakdowns from degreecalc.com’s 2026 college housing analysis. A student signing a 12-month lease for a 9-month academic year either pays three months of empty-apartment rent or takes on subletting risk — a structural cost that rarely appears in the breezy off-campus comparisons families encounter online.
Groceries add another layer. On campus, the meal plan forces a fixed food spend whether or not the student uses every swipe. Off campus, the College Board’s 2025-26 budget allowance for food is folded into the off-campus cost-of-attendance estimate, but actual grocery spending depends heavily on cooking habits. College students spending $263 per month on groceries and $410 per month dining out — figures reported by the Education Data Initiative — would exceed the frugal off-campus food budget in short order.
The upshot: the published on-campus figure is a ceiling. The off-campus figure, depending on market and behavior, is a floor.
The Market Variable Nobody Controls
National averages mask the variable that dominates the actual decision: geography. The NCES IPEDS 2023-24 data puts average off-campus housing and food costs at $12,535 annually — about $266 less than the average on-campus figure of $12,801 in the same dataset. That $266 gap implies rough equivalence, but it is an average of radically different markets.
Per-person monthly rent data for off-campus student housing tells the real story. In small college towns — think Provo, Fort Collins, Boise — shared apartments run $450–$800 per person per month, well below even the cheapest on-campus options. In large Sun Belt metros like Denver or San Diego, the range is $900–$1,600 per person. In high-cost coastal markets, New York is above $2,000 per bed monthly, Boston averages $1,800–$2,400 per person in student-friendly neighborhoods like Allston and Brighton, and overall city rents in Boston have ranged from $3,200–$3,400 per month for average apartments as of 2025, according to rental market data. Median monthly rent in Austin sits at approximately $2,250, per the Hechinger Report’s 2025 reporting.
At Boston or New York schools, a student going off campus solo can easily spend $21,600–$30,000 per year on rent alone — exceeding the on-campus rate by $6,000 to $14,000 before a single utility bill. With roommates in those same markets, a split two-bedroom might bring the per-person cost to $1,200–$1,500 per month, or $10,800–$13,500 for a nine-month academic period. That starts to compete with on-campus room cost, but not once food, utilities, and the 12-month lease premium are added back in.
For families evaluating this decision for a out-of-state tuition versus in-state cost gap, the housing market at the destination school matters as much as the tuition differential. A cheaper out-of-state school in a high-rent city can cost more in total than an expensive in-state school in a lower-rent market.
The Full Off-Campus Cost Model
Most families run an incomplete comparison. They take the off-campus monthly rent and multiply by nine months, then compare to the on-campus annual rate. This misses the real total cost. The correct model annualizes every cost component across the full lease period.
| Cost Component | Low-Rent College Town | Mid-Size University City | High-Cost Coastal Market |
|---|---|---|---|
| Rent (per person, 12-month lease) | $7,200 ($600/mo) | $13,200 ($1,100/mo) | $21,600 ($1,800/mo) |
| Utilities (electricity, water, internet) | $1,320 ($110/mo) | $1,800 ($150/mo) | $2,400 ($200/mo) |
| Groceries and food (12 months) | $3,156 ($263/mo) | $3,156 ($263/mo) | $3,500 ($292/mo est.) |
| Renter’s insurance (12 months) | $216 ($18/mo) | $240 ($20/mo) | $300 ($25/mo) |
| Transportation to campus | $600 ($50/mo) | $1,200 ($100/mo) | $1,800 ($150/mo) |
| First-year furniture (amortized Year 1) | $750 | $1,000 | $1,500 |
| Security deposit (one-time, Year 1) | $600 | $1,100 | $1,800 |
| Total Year 1 Estimated Cost | $13,842 | $21,696 | $32,900 |
| On-Campus Benchmark (2025-26) | $13,900 (public) | $13,900 (public) | $15,920 (private) |
| Off-Campus Premium / (Savings) vs. On-Campus | ($58) savings | +$7,796 | +$16,980 |
Rent ranges: Education Data Initiative / findmyplace.co 2026 off-campus housing analysis using NCES data; utilities and renter’s insurance: degreecalc.com 2026; grocery estimate: Education Data Initiative; transportation: degreecalc.com 2026; furniture: findmyplace.co 2026; on-campus benchmarks: College Board, Trends in College Pricing and Student Aid 2025. Figures are per-student estimates assuming one roommate; Year 1 includes one-time costs. Individual results vary by specific school, market, and household.
In a low-rent college town, off-campus with a roommate essentially breaks even against the on-campus public university rate — but only barely, and only in Year 1 after absorbing the security deposit and furniture. By Year 2, once one-time setup costs disappear, the off-campus savings become real. In a mid-size university city, the off-campus student pays roughly $7,800 more per year than the on-campus benchmark, which is a number that should appear explicitly in any 529 funding target calculation for families planning ahead.
The Meal Plan Problem
Many families focus exclusively on rent when comparing housing options, treating the meal plan as a constant. It is not. On-campus costs bundle a mandatory meal plan that averages $6,205 per year nationally (Education Data Initiative, 2025-26). Students who live off campus replace that with grocery spending — but the replacement cost is highly variable and often underestimated.
The annual per-person cost of groceries for a household in 2024 averaged $2,593, according to Bureau of Labor Statistics consumer expenditure data cited by the Education Data Initiative. That figure is 42% below the average college meal plan cost. On paper, cooking looks like a $3,600-per-year saving. In practice, a 19-year-old who eats out twice a week, orders delivery, and wastes a portion of weekly groceries rarely hits that number. The Education Data Initiative estimates off-campus college students spend $263 per month on groceries and $410 per month dining out — a combined $8,076 annually, which actually exceeds the average meal plan cost.
Disciplined cooking is a legitimate savings lever. The average meal plan cost is not defensible if the student actually cooks. But “the student will cook” is a projection, not a fact, and households with $150k+ incomes should budget for the observed behavior rather than the hypothetical one when modeling total cost of attendance (COA). The complete college cost framework for $150k+ households depends on realistic food assumptions.
The Overlooked Variable: Aid Treatment of Off-Campus Housing
Most coverage of this topic focuses entirely on the rent-versus-dorm comparison. What it consistently misses: how housing choice interacts with financial aid calculations.
Schools set the cost of attendance, which includes a housing allowance regardless of where the student lives. For families at $150k+, need-based aid is minimal at most institutions — the Student Aid Index under the revised Free Application for Federal Student Aid typically prices out households at this income level from need-based grants at all but the most generous private universities. So the aid interaction may seem irrelevant. It is not, for one specific reason: the COA determines the borrowing limit for federal student loans. If a student needs to borrow at all, the COA sets the ceiling on what can be borrowed. A school that uses a low off-campus housing allowance in its COA — common at urban schools with expensive rental markets — can constrain borrowing precisely when actual off-campus costs are highest. The gap between the school’s off-campus COA allowance and the real market cost falls entirely on the family.
For a household with a student at a Boston-area private university, this gap can run $6,000–$10,000 per year between what the school’s COA acknowledges for off-campus housing and what market rents actually cost. Families reviewing private university net costs at $150k income should pull the school’s specific COA breakdown for off-campus housing before assuming the published allowance is realistic. It often is not.
Finluxy College Investment Ratio: Housing’s Role in the Full Picture
The Finluxy College Investment Ratio measures 4-year net cost of attendance divided by the median starting salary for the institution’s top major(s). Housing is the single largest variable in the non-tuition component of COA — and, as the scenarios above show, it can swing the 4-year net cost by $30,000 or more depending on market and housing choice. Below is how two representative school profiles change based on housing scenario.
| Scenario | Annual Tuition + Fees (sticker) | Annual Housing + Food | Other COA (books, transport, personal) | 4-Year Total COA | Median Starting Salary (reference major) | Finluxy College Investment Ratio |
|---|---|---|---|---|---|---|
| Public flagship, on-campus (in-state) | $11,950 | $13,900 | $4,500 | $120,600 | $81,198 (engineering, NACE 2025-26) | 1.49 years |
| Public flagship, off-campus high-cost city | $11,950 | $28,000 (est. coastal market) | $5,500 | $182,000 | $81,198 (engineering, NACE 2025-26) | 2.24 years |
| Private nonprofit, on-campus | $45,000 | $15,920 | $4,800 | $263,680 | $81,535 (computer science, NACE 2025-26) | 3.23 years |
| Private nonprofit, off-campus coastal market | $45,000 | $32,900 (Year 1 est.) | $5,500 | $334,160 | $81,535 (computer science, NACE 2025-26) | 4.10 years |
Tuition figures: College Board, Trends in College Pricing and Student Aid 2025. On-campus housing: College Board 2025-26. Off-campus coastal market estimate: per-student model from table above (Year 1). Starting salary: NACE Winter 2025 Salary Survey / Class of 2026 projections. Finluxy College Investment Ratio = 4-year net COA ÷ median starting salary. Figures represent sticker-price COA; net price after aid would reduce the ratio for qualifying households. Other COA components estimated from College Board 2025-26 published budget allowances.
The ratio’s sensitivity to housing is not trivial. Moving a private university student from on-campus ($15,920/year) to off-campus in a coastal market (~$32,900 in Year 1) pushes the Finluxy College Investment Ratio from 3.23 years to 4.10 years — crossing the threshold the cluster framework identifies as financial risk territory for career-uncertain paths. For a student in computer science or engineering with strong salary certainty, 4.10 years is manageable. For liberal arts or social sciences where median starting salaries run $45,000–$55,000, the same housing decision at a private coastal school can push the ratio above 6.0 — a figure that warrants hard scrutiny before signing any lease. Families should review how college ROI varies by major and debt load in conjunction with the housing scenario analysis.
When Off-Campus Actually Wins
Three conditions have to be true simultaneously for off-campus housing to deliver real savings over four years: the rental market is low-to-moderate cost, the student has reliable roommates (minimum two, ideally three), and the lease term matches the academic calendar or subletting is genuinely feasible. When all three are present — a college town in a mid-cost market, a stable four-person lease, and an academic-year rental — off-campus can save $2,000–$5,000 per year versus on-campus, compounded across four years into a $8,000–$20,000 total savings. That is real money, and it belongs in the 529 planning conversation as a potential COA reduction.
When any one of those three conditions is missing, the math quickly reverses. A high-cost market alone — regardless of roommate count — can eliminate the savings entirely. A 12-month lease at $1,100 per person per month in a mid-size city costs $13,200 in rent before a single additional expense. Add utilities, food, and the first-year setup, and the $21,696 Year 1 figure in the table above is conservative. Compare that to the $13,900 on-campus benchmark and the “off-campus is cheaper” assumption deserves serious stress-testing.
For families whose students attend schools in high-rent urban markets and who are also navigating financial aid realities above $200k in household income, on-campus housing may be the lower-cost option even before accounting for the simplicity premium that comes with no lease to manage, no utilities to split, and no subletting negotiation over winter break.
The $150k+ Household Decision Framework
At $150k+ household income, financial aid for housing is essentially off the table at most institutions. The Student Aid Index under FAFSA produces aid eligibility that leaves housing costs fully on the family at this income level, whether on-campus or off. That means every dollar of housing cost difference is real out-of-pocket cash — not an aid displacement.
The relevant decisions are: whether the housing market at the specific school makes off-campus viable, whether the family’s cash flow can absorb the front-loaded costs of an off-campus move (deposit, furniture, first and last month’s rent — often $3,000–$5,000 in Year 1 before rent begins), and whether the 4-year housing cost has been properly modeled into the overall public versus private net cost comparison.
Families weighing prestigious school versus state school outcomes at similar income levels often discover the sticker-price tuition gap is only part of the story. Housing cost in the school’s host market can add $15,000–$40,000 to the four-year total versus a lower-cost alternative, a figure that belongs in any rigorous school comparison. The Finluxy College Investment Ratio provides a consistent lens: calculate it at on-campus rates first, then recalculate at realistic off-campus costs for the specific market. If the ratio crosses 4.0 on a realistic off-campus scenario and the career path is not high-certainty earnings, the housing decision is materially affecting the investment return of the entire degree.
For households already running student loan repayment scenarios on $100k in debt, the housing choice made at freshman year can affect whether loans enter the picture at all. An extra $7,000 per year in off-campus costs at a mid-size market, over four years, equals $28,000 in additional costs — roughly a full semester’s tuition at a public flagship, or a meaningful portion of a 529 balance that took years to build.
Frequently Asked Questions
Is off-campus housing always cheaper than on-campus?
No — and the national average data is misleading on this point. NCES IPEDS 2023-24 data shows average off-campus housing and food costs of $12,535 versus $12,801 on-campus, a difference of $266. But that national average includes low-cost college towns that pull the average down. In high-cost coastal markets, a student going off-campus without multiple roommates can spend $20,000 or more annually on housing alone, far exceeding the on-campus rate. The decision is market-specific, not a general rule.
What hidden costs do families most often miss when comparing on-campus to off-campus?
The most commonly missed costs are: the 12-month lease obligation (paying rent during summer when the student may not be there), utilities bundled into on-campus housing but billed separately off-campus ($100–$200 per month), first-year furniture ($500–$1,500), the security deposit (typically one month’s rent), and renter’s insurance ($15–$30 per month). Together these can add $4,000–$7,000 to Year 1 off-campus costs before the comparison becomes clean.
How does the Finluxy College Investment Ratio change with off-campus housing?
Substantially, in high-cost markets. At a private nonprofit university at on-campus sticker price, the Finluxy College Investment Ratio (4-year COA ÷ median starting salary) runs around 3.23 years for an engineering or computer science graduate. Add off-campus coastal market housing costs across four years and the same ratio rises to approximately 4.10 years — crossing into financial-risk territory by the cluster’s own scale. The housing decision is not peripheral to the investment calculation; it is part of it.
Does living off-campus affect financial aid or borrowing limits?
At $150k+ household income, need-based aid is minimal at most schools under the current FAFSA / Student Aid Index framework, so the direct aid impact is limited. However, the school’s cost-of-attendance calculation — which sets the ceiling for federal loan borrowing — uses an off-campus housing allowance that may not reflect actual market rents. At urban schools in expensive markets, the gap between the COA’s off-campus allowance and real rental costs can run $6,000–$10,000 per year, a gap that falls entirely on the family with no borrowing offset.
At what point does a 529 plan need to account for higher off-campus costs?
When modeling the 529 target, families should use the realistic COA for their specific school and housing scenario — not the published on-campus average. If the school is in a high-cost market and off-campus housing is likely, the four-year housing budget may need to be $40,000–$60,000 higher than the national on-campus benchmark implies. That difference compounds in the 529 model: under a 5% annual COA inflation assumption, underestimating the housing component by $10,000 per year translates to a $40,000+ gap in the 18-year savings target. Revisit 529 monthly contribution targets by child’s age using the school-specific housing scenario, not the national average.
Methodology
On-campus room and board figures are from the College Board’s Trends in College Pricing and Student Aid 2025 (November 2025), the primary source for published cost-of-attendance data. These are enrollment-weighted national averages for 2025-26. Off-campus cost comparisons use NCES IPEDS 2023-24 average figures (the most recent NCES dataset with full institutional reporting at time of research) as the national baseline, supplemented by Education Data Initiative’s 2025-26 analysis of NCES and College Board data for sector-specific breakdowns.
Off-campus market scenario ranges are constructed from Education Data Initiative’s 2026 analysis of NCES figures for per-student off-campus costs, cross-referenced with findmyplace.co’s 2026 off-campus rental cost breakdown by market type and degreecalc.com’s 2026 college housing cost analysis. Hidden cost component ranges (utilities, insurance, furniture, deposits) draw on degreecalc.com’s 2026 methodology and findmyplace.co’s 2026 research. These are illustrative estimates; actual costs vary by school, lease structure, roommate arrangement, and local market conditions.
Starting salary figures for the Finluxy College Investment Ratio are from the National Association of Colleges and Employers (NACE) Winter 2025 Salary Survey, reflecting Class of 2026 projections. The Finluxy College Investment Ratio is calculated as 4-year total COA (at sticker price) divided by the referenced median starting salary. No merit or need-based aid reductions are applied to the ratio tables; net price versions of the ratio would be lower for qualifying households. Families should consult the NCES Net Price Calculator for institution-specific net price estimates.
Sources & References
- College Board — Trends in College Pricing and Student Aid 2025 (November 2025)
- NCES IPEDS — Institutional Characteristics and Cost of Attendance Data, 2023-24
- Education Data Initiative — Average Cost of Room and Board at College, 2025-26
- Education Data Initiative — Average Cost of College, 2026 analysis
- NACE — Winter 2025 Salary Survey: Starting Salary Projections for Class of 2026
- findmyplace.co — Off-Campus Student Housing Costs in 2026: Market Breakdown
- degreecalc.com — College Housing Costs 2026: Dorm vs Apartment vs Commuting
- Hechinger Report — The Fastest-Growing College Cost: Housing, August 2025
- College Raptor — On vs Off Campus Cost Comparison Using NCES IPEDS 2023-24 Data