 Analysis by
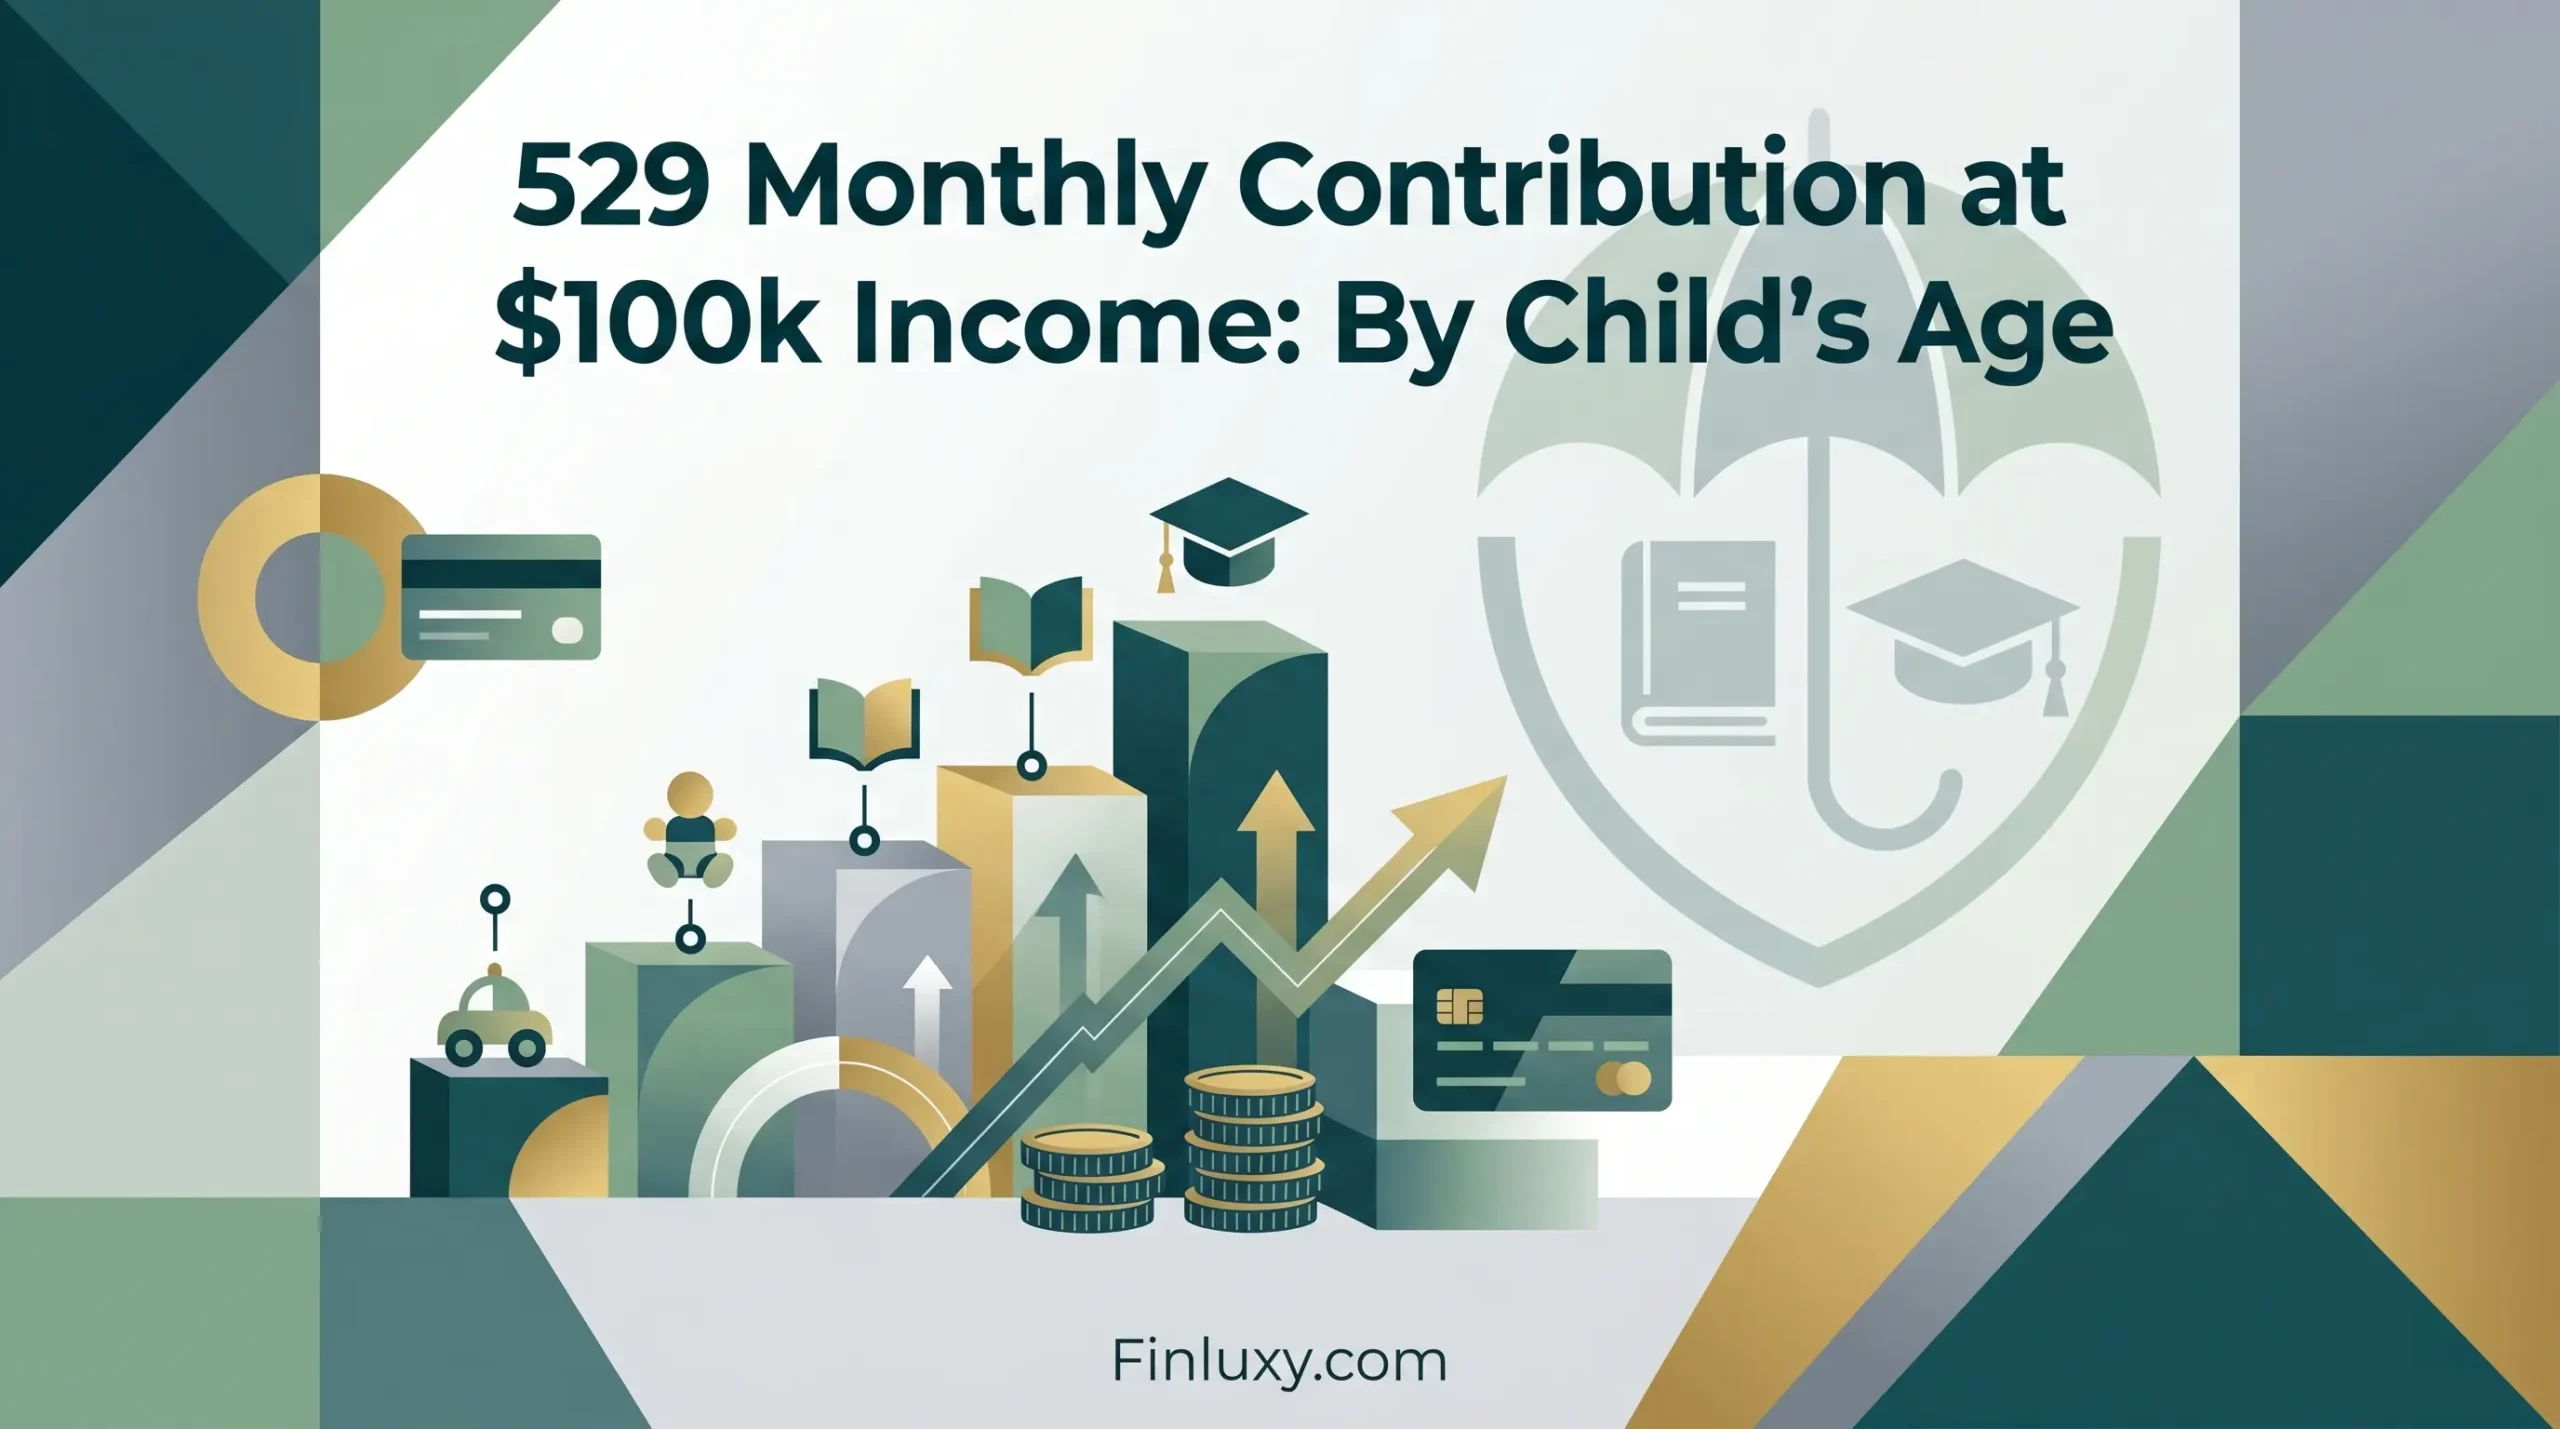
A family with a newborn and $100k household income that targets a public in-state university needs to save $757 per month starting today — assuming a 7% annual return and 5% annual college cost inflation. Wait until the child is ten, and that figure nearly doubles to $1,541. Wait until thirteen, and it exceeds $2,300. The math doesn’t care about intent.
This analysis calculates the required monthly 529 contribution by child’s age for two targets: the average public four-year in-state university and the average private nonprofit four-year university, using 2025-26 cost of attendance (COA) data from the College Board, 5% annual COA inflation, and a 7% annual portfolio return. It then applies the Finluxy College Investment Ratio to frame the investment decision by major and institution type.
Scope and Data Disclaimer: All COA figures are from the College Board’s Trends in College Pricing and Student Aid 2025 report (2025-26 academic year, published November 2025). These are national averages — actual costs vary significantly by school and state. Net price figures at the $100k income level are ranges sourced from NCES IPEDS aggregate data and Brookings Institution analysis, because IPEDS income-bracket net price data is reported with a two-year lag. Starting salary figures are from the National Association of Colleges and Employers (NACE) Winter 2025 Salary Survey projections for the Class of 2025. Contribution figures assume monthly contributions beginning now, no existing savings balance, and a consistent 7% annual return. Market returns are not guaranteed. This article is a data-driven cost analysis and does not constitute financial or investment advice.
Key Numbers at a Glance
| Metric | Public In-State Target | Private Nonprofit Target |
|---|---|---|
| Current annual COA (2025-26) | $30,990 | $65,470 |
| Projected 4-yr total (newborn, 5% inflation) | $321,488 | $679,143 |
| Monthly contribution — child age 0 | $757/month | $1,600/month |
| Monthly contribution — child age 10 | $1,541/month | $3,255/month |
| Monthly contribution — child age 13 | $2,381/month | $5,031/month |
Sources: College Board, Trends in College Pricing and Student Aid 2025. Contribution figures calculated using 5% annual COA inflation, 7% annual portfolio return, monthly compounding, contributions beginning at listed age.
What the Target Actually Costs: Baseline COA
The College Board’s 2025-26 data puts the average full COA — tuition, fees, room, board, books, transportation, and personal expenses — at $30,990 per year for a public four-year in-state student and $65,470 for a private nonprofit four-year student. Four years at sticker price therefore runs $123,960 and $261,880, respectively, in today’s dollars.
Neither figure is what a $100k household will actually pay. The financial aid reality at $100k–$130k household income is nuanced: families in this range fall in the IPEDS income bracket of $75,001–$110,000, which historically receives modest but real aid at both public and private institutions. NCES data from 2021-22 shows average net price across all incomes at public four-year schools was $15,200 — but that figure includes students across all income levels. For the $75k-$110k bracket specifically, IPEDS bracket data and Brookings Institution analysis suggest net price ranges from roughly $20,000–$26,000 per year at public schools and $28,000–$45,000 per year at private schools (with the high end of the private range representing near-sticker prices at schools with smaller endowments).
For the 529 contribution calculation, I use the full sticker COA as the savings target, for a specific reason: aid packages cannot be assumed. Merit aid is school-dependent and income-independent. Need-based aid at $100k is not guaranteed and varies dramatically between institutions. Planning to the full COA and receiving aid creates excess that can be rolled into a Roth IRA under SECURE 2.0 (up to $35,000 lifetime, after 15 years of account age). Planning to a net price estimate and receiving less aid than expected creates debt.
Monthly Contribution Required by Child’s Age
The model inflates today’s COA at 5% per year to the child’s projected freshman year, sums all four years of inflation-adjusted costs, then calculates the monthly savings amount needed using a 7% annual return (monthly compounding). No existing balance is assumed.
| Child’s Age | Years to College | Projected 4-Yr Total COA | Required Monthly Contribution |
|---|---|---|---|
| Newborn (0) | 18 | $321,488 | $757 |
| 3 | 15 | $277,637 | $876 |
| 6 | 12 | $239,911 | $1,066 |
| 10 | 8 | $197,402 | $1,541 |
| 13 | 5 | $170,417 | $2,381 |
| 16 | 2 | $147,260 | $5,762 |
Assumptions: College Board 2025-26 public in-state COA of $30,990/year as baseline; 5% annual cost inflation; 7% annual portfolio return; monthly compounding; zero starting balance. Projected 4-yr totals sum all four inflation-adjusted annual costs from freshman year.
The private nonprofit target produces substantially larger numbers across every age band. Starting at birth, the required monthly contribution to fund the full $65,470 average COA (inflated) is $1,600. That’s more than double the public target — and the gap widens as the savings window compresses.
| Child’s Age | Years to College | Projected 4-Yr Total COA | Required Monthly Contribution |
|---|---|---|---|
| Newborn (0) | 18 | $679,143 | $1,600 |
| 3 | 15 | $586,535 | $1,851 |
| 6 | 12 | $506,680 | $2,251 |
| 10 | 8 | $416,969 | $3,255 |
| 13 | 5 | $360,095 | $5,031 |
| 16 | 2 | $311,107 | $12,172 |
Assumptions: College Board 2025-26 private nonprofit COA of $65,470/year as baseline; 5% annual cost inflation; 7% annual portfolio return; monthly compounding; zero starting balance.
The age-16 private figure — $12,172 per month for two years — is not a savings target in any practical sense for a $100k household. At that point, the question is no longer about 529 optimization; it’s a question of cash flow, loans, and institutional selectivity. The student loan repayment math on $100k debt becomes the relevant analysis.
What Delays Cost: The Compounding Penalty
Starting at age 3 instead of birth for the public target means an additional $119 per month ($876 vs. $757) — $1,428 per year — to chase the same goal. That gap seems manageable. But waiting until age 10 adds $784 per month over the newborn baseline. Waiting until age 13 adds $1,624 per month. The compounding penalty does not scale linearly; it accelerates as the growth window shortens.
Another way to read these tables: a parent who started saving $757/month at birth will accumulate roughly the same projected COA target as one who saves $1,541/month starting at age 10 — despite contributing $109,008 less in total nominal dollars over the same child’s life. The difference is entirely time and compounding, not the monthly amount itself.
This compounding dynamic is also why the private target at age 13 ($5,031/month) represents 60% of a $100k gross income channeled into a single account — a figure that makes the true net cost gap between public and private universities far more visible than any brochure will show.
Finluxy College Investment Ratio: Public vs. Private at $100k Income
The Finluxy College Investment Ratio measures how many years of starting salary the degree costs at net price. For this calculation, net price — not the sticker COA — is the input, because it reflects what the family actually pays after grants and scholarships. At $100k household income, NCES IPEDS bracket data and Brookings Institution research (2025) indicate a net price range of approximately $20,000–$26,000/year at public four-year schools and $28,000–$45,000/year at private nonprofits. The upper bound of the private range applies to schools with smaller endowments that apply near-sticker pricing to middle-income families. The lower bound applies to highly endowed schools with strong aid programs.
Starting salaries come from the NACE Winter 2025 Salary Survey: engineering majors at $78,731 and business majors at $65,276 for the Class of 2025 bachelor’s graduates.
| Scenario | 4-Yr Net Cost Range | Starting Salary | Finluxy College Investment Ratio | ROI Signal |
|---|---|---|---|---|
| Public in-state / Engineering | $80,000–$104,000 | $78,731 | 1.02–1.32 years | Strong |
| Public in-state / Business | $80,000–$104,000 | $65,276 | 1.23–1.59 years | Strong |
| Private nonprofit / Engineering | $112,000–$180,000 | $78,731 | 1.42–2.29 years | Strong to Moderate |
| Private nonprofit / Business | $112,000–$180,000 | $65,276 | 1.72–2.76 years | Moderate |
| Private nonprofit / All-major avg. | $112,000–$180,000 | $68,680 | 1.63–2.62 years | Moderate |
Net price ranges: NCES IPEDS 2021-22 aggregate data; Brookings Institution (2025) income-bracket analysis. Starting salaries: NACE Winter 2025 Salary Survey (Class of 2025 projections). Finluxy College Investment Ratio = 4-yr net cost ÷ median starting salary for listed major. Scale: under 1.5 years = strong ROI; 1.5–4.0 years = moderate, career-dependent; over 4.0 years = financial risk.
Every scenario here falls in the “strong” or “moderate” range — none cross the 4.0-year threshold that signals significant financial risk. The critical variable isn’t public vs. private in isolation; it’s the combination of institutional aid generosity and major choice. A $100k-income family sending a child to a low-endowment private school in a low-earning major can push the ratio toward 2.76 years or higher. The same family at a well-endowed private school with a STEM major can produce a ratio of 1.42 — nearly identical to a public school outcome. The college ROI by major is not a secondary consideration; at $100k income, it’s the primary lever on the investment return.
The Overlooked Factor: What the Data Shows That Most Coverage Misses
Most 529 savings guides frame the contribution target as a fixed percentage of future COA — commonly cited at 50%. The logic is that loans, work, and aid will cover the rest. At $100k household income, this assumption has a specific problem: the aid scenario is less predictable than it is at lower incomes. IPEDS data shows the $75k-$110k bracket receives an average of roughly 13% of COA in federal Title IV aid at public institutions — not nothing, but far from enough to close a meaningful gap. The family cannot reliably count on it.
What the data shows that most savings calculators omit: the real compression happens not between age 0 and age 5, but between age 10 and age 13. For the public target, the three-year delay from starting at 10 versus 13 increases monthly contributions by $840 — a larger monthly jump than the entire seven-year delay from starting at birth versus age 7. That non-linearity is mathematically inherent to compounding but rarely visualized. For a $100k household managing mortgage payments, retirement contributions, and general cost-of-living pressures, understanding exactly where the cost curve steepens is more decision-useful than a generic “start early” directive.
A related data point: College Board’s 2025 report shows public university COA at $100k family income has been rising approximately 3% per year in nominal terms — which, after inflation adjustment, means effectively flat to slightly declining real cost at public schools. The 5% inflation assumption used in this model is therefore conservative, particularly for private nonprofits whose sticker prices grew 4.0% in 2025-26 before inflation adjustment.
FAFSA, the Student Aid Index, and the $100k Income Bracket
The Free Application for Federal Student Aid — the gateway to federal, state, and most institutional aid — underwent a significant structural change under the FAFSA Simplification Act. The Expected Family Contribution (EFC), the old metric, has been replaced by the Student Aid Index (SAI). The transition affects how assets and income are counted, and the SAI formula for families at $100k income generally produces a figure that limits Pell Grant eligibility while still allowing some institutional need-based aid at private schools with deep endowments.
Parent-owned 529 plan assets are assessed at a maximum rate of 5.64% toward the SAI — meaning a $60,000 529 balance reduces aid eligibility by at most $3,384. That’s a minor penalty for a major tax-advantaged savings vehicle. Grandparent-owned 529 distributions are no longer counted as student income on the FAFSA following post-SECURE 2.0 rule changes, which eliminates what had previously been a significant planning complication. For $100k households deciding between 529 contribution strategies by child’s age, the FAFSA impact is effectively negligible relative to the tax-free growth benefit.
Scenario: Starting at Age 6 with an Existing Balance
The tables above assume a zero starting balance. A family that opens a 529 at birth and contributes modestly — say, $200/month — for six years accumulates approximately $18,000 at 7% annual return. If contributions then increase to match the age-6 target for the public school scenario, the required monthly contribution drops from $1,066 to roughly $780. The $18,000 head start reduces the ongoing monthly burden by about $286 — equivalent to more than seven months of the original $200 contribution.
That illustrative scenario is not presented here as a recommendation; it illustrates the leverage of any early balance. Even small early contributions shift the compounding math meaningfully. The out-of-state tuition vs. in-state true cost gap adds another dimension: families contributing to the public COA baseline ($30,990) would need an entirely different — and larger — target if their child ultimately attends out-of-state, where the College Board’s 2025-26 average total COA is $50,920.
Methodology
COA baseline figures are from the College Board’s Trends in College Pricing and Student Aid 2025 report, covering the 2025-26 academic year (published November 2025). This is the most current full-year dataset available. Public four-year in-state COA: $30,990. Private nonprofit four-year COA: $65,470. Both figures are national enrollment-weighted averages.
The 529 contribution model uses the Cluster Brief methodology: projected 4-year COA is calculated by inflating the annual COA at 5% per year from the child’s current age to each of the four college years, then summing all four. Monthly contribution is derived from the standard present-value-of-annuity formula: PMT = Target ÷ [((1 + r)^n − 1) / r], where r = 0.07/12 and n = total months of contributions. No initial balance is assumed.
Net price ranges at $100k household income use NCES IPEDS 2021-22 aggregate net price data as a structural reference and are scaled to current COA levels using College Board’s published sticker price growth rates. Brookings Institution income-bracket analysis (2025) is used as a secondary source for private nonprofit net price ranges by income. Exact IPEDS income-bracket data at a current year was not available through search; ranges are presented accordingly.
Starting salary data comes from the NACE Winter 2025 Salary Survey (projections for Class of 2025, published February 2025). The Finluxy College Investment Ratio divides the midpoint of each net price range by the stated major’s starting salary to produce a ratio expressed in years of starting salary.
Frequently Asked Questions
Why does the model use 5% cost inflation and 7% return — aren’t those assumptions aggressive?
The 5% COA inflation assumption is actually slightly above recent College Board data, which shows 2.9% nominal growth at public four-year schools and 4.0% at private nonprofits for 2025-26. Using 5% builds a conservative buffer into the target. The 7% annual return is consistent with long-run historical equity market averages and is a widely used assumption for age-based 529 portfolios in early contribution years. Families with shorter savings windows (child age 10+) should recognize that a more conservative asset allocation reduces expected return below 7%, which would increase the required monthly contribution.
What happens if the child receives more aid than expected and I over-fund the 529?
Under SECURE 2.0, up to $35,000 lifetime can be rolled from a 529 into a Roth IRA for the beneficiary, provided the account has been open for at least 15 years and annual rollovers don’t exceed the Roth contribution limit ($7,000 in 2025, adjusted annually). The beneficiary can also be changed to another family member. Non-educational withdrawals of earnings face income tax plus a 10% penalty — but the contributions themselves are always returned tax-free. Over-funding is generally preferable to under-funding for families at $100k income who cannot rely on substantial need-based aid to bridge gaps.
Does the 529 balance affect FAFSA aid eligibility at $100k income?
Yes, but minimally. Parent-owned 529 assets are assessed at a maximum of 5.64% in the Student Aid Index calculation — down from 5.64% under the old Expected Family Contribution formula. A $100,000 529 balance reduces the family’s aid eligibility by at most $5,640. At $100k household income, the family is unlikely to qualify for substantial need-based aid at most institutions regardless of 529 balance, so this impact is largely theoretical. Grandparent-owned 529 distributions no longer count as student income on the FAFSA following post-SECURE 2.0 rule changes, which had previously been a deterrent to grandparent-funded accounts.
Should I target the full COA or just net price in my 529 calculations?
At $100k household income, targeting the full COA is the more defensible approach for two reasons. First, aid at this income level is institution-specific and not guaranteed — building to the full COA and receiving aid produces excess that can be redirected. Second, college selection itself hasn’t happened yet. A child who is ten today may be accepted to, and choose, a school with a COA significantly above the national average. Targeting the national average COA leaves a gap if the actual school is more expensive. For families evaluating the private university cost at higher household incomes, the same logic applies with even fewer aid assumptions warranted.
Context for $150k+ Households
A $150k+ household faces essentially the same compounding math as the $100k case, but with a narrower expected aid cushion. At $150k income, financial aid eligibility at private institutions diminishes further, which pushes the effective sticker-to-net-price discount down. For households at this income level, the monthly contribution targets in the tables above represent realistic floor estimates, not planning buffers. A $150k household can more readily absorb the $757 public-target monthly figure from birth without material budget strain — but the private target of $1,600/month represents over 12% of gross monthly income at that earnings level, which competes directly with retirement contribution goals, mortgage amortization, and taxable investment accounts. The Ivy League net price at $175k income introduces a further wrinkle: elite institutions with the largest endowments can deliver net prices that undercut mid-tier private schools, which inverts the conventional assumption that more selective equals more expensive. Running the Finluxy College Investment Ratio across specific target schools — not just sector averages — is the more precise planning tool once a family has a short list of institutions. For households weighing whether to fund a 529 aggressively versus investing in taxable accounts, the tax-free growth and qualified withdrawal benefit of the 529 is difficult to replicate, particularly for a $150k+ household in a higher marginal bracket where deferred gains on equity investments create a real after-tax cost advantage over time. Any decision to shift savings outside the 529 wrapper should account for state income tax deductions on contributions, which reduce the effective cost of each dollar contributed.
Sources & References
- College Board — Trends in College Pricing and Student Aid 2025 (2025-26 COA data)
- College Board Newsroom — Trends in College Pricing 2025 press release, November 2025
- NCES Condition of Education — Price of Attending an Undergraduate Institution (2021-22 net price data)
- NCES IPEDS — Integrated Postsecondary Education Data System (income-bracket net price data)
- Brookings Institution — College prices are falling for everyone (almost), 2025 (net price by income bracket)
- NACE — Winter 2025 Salary Survey: Class of 2025 starting salary projections by major
- NASFAA — Sticker vs. Net Price in 2024-25: College Board report summary, November 2024