 Analysis by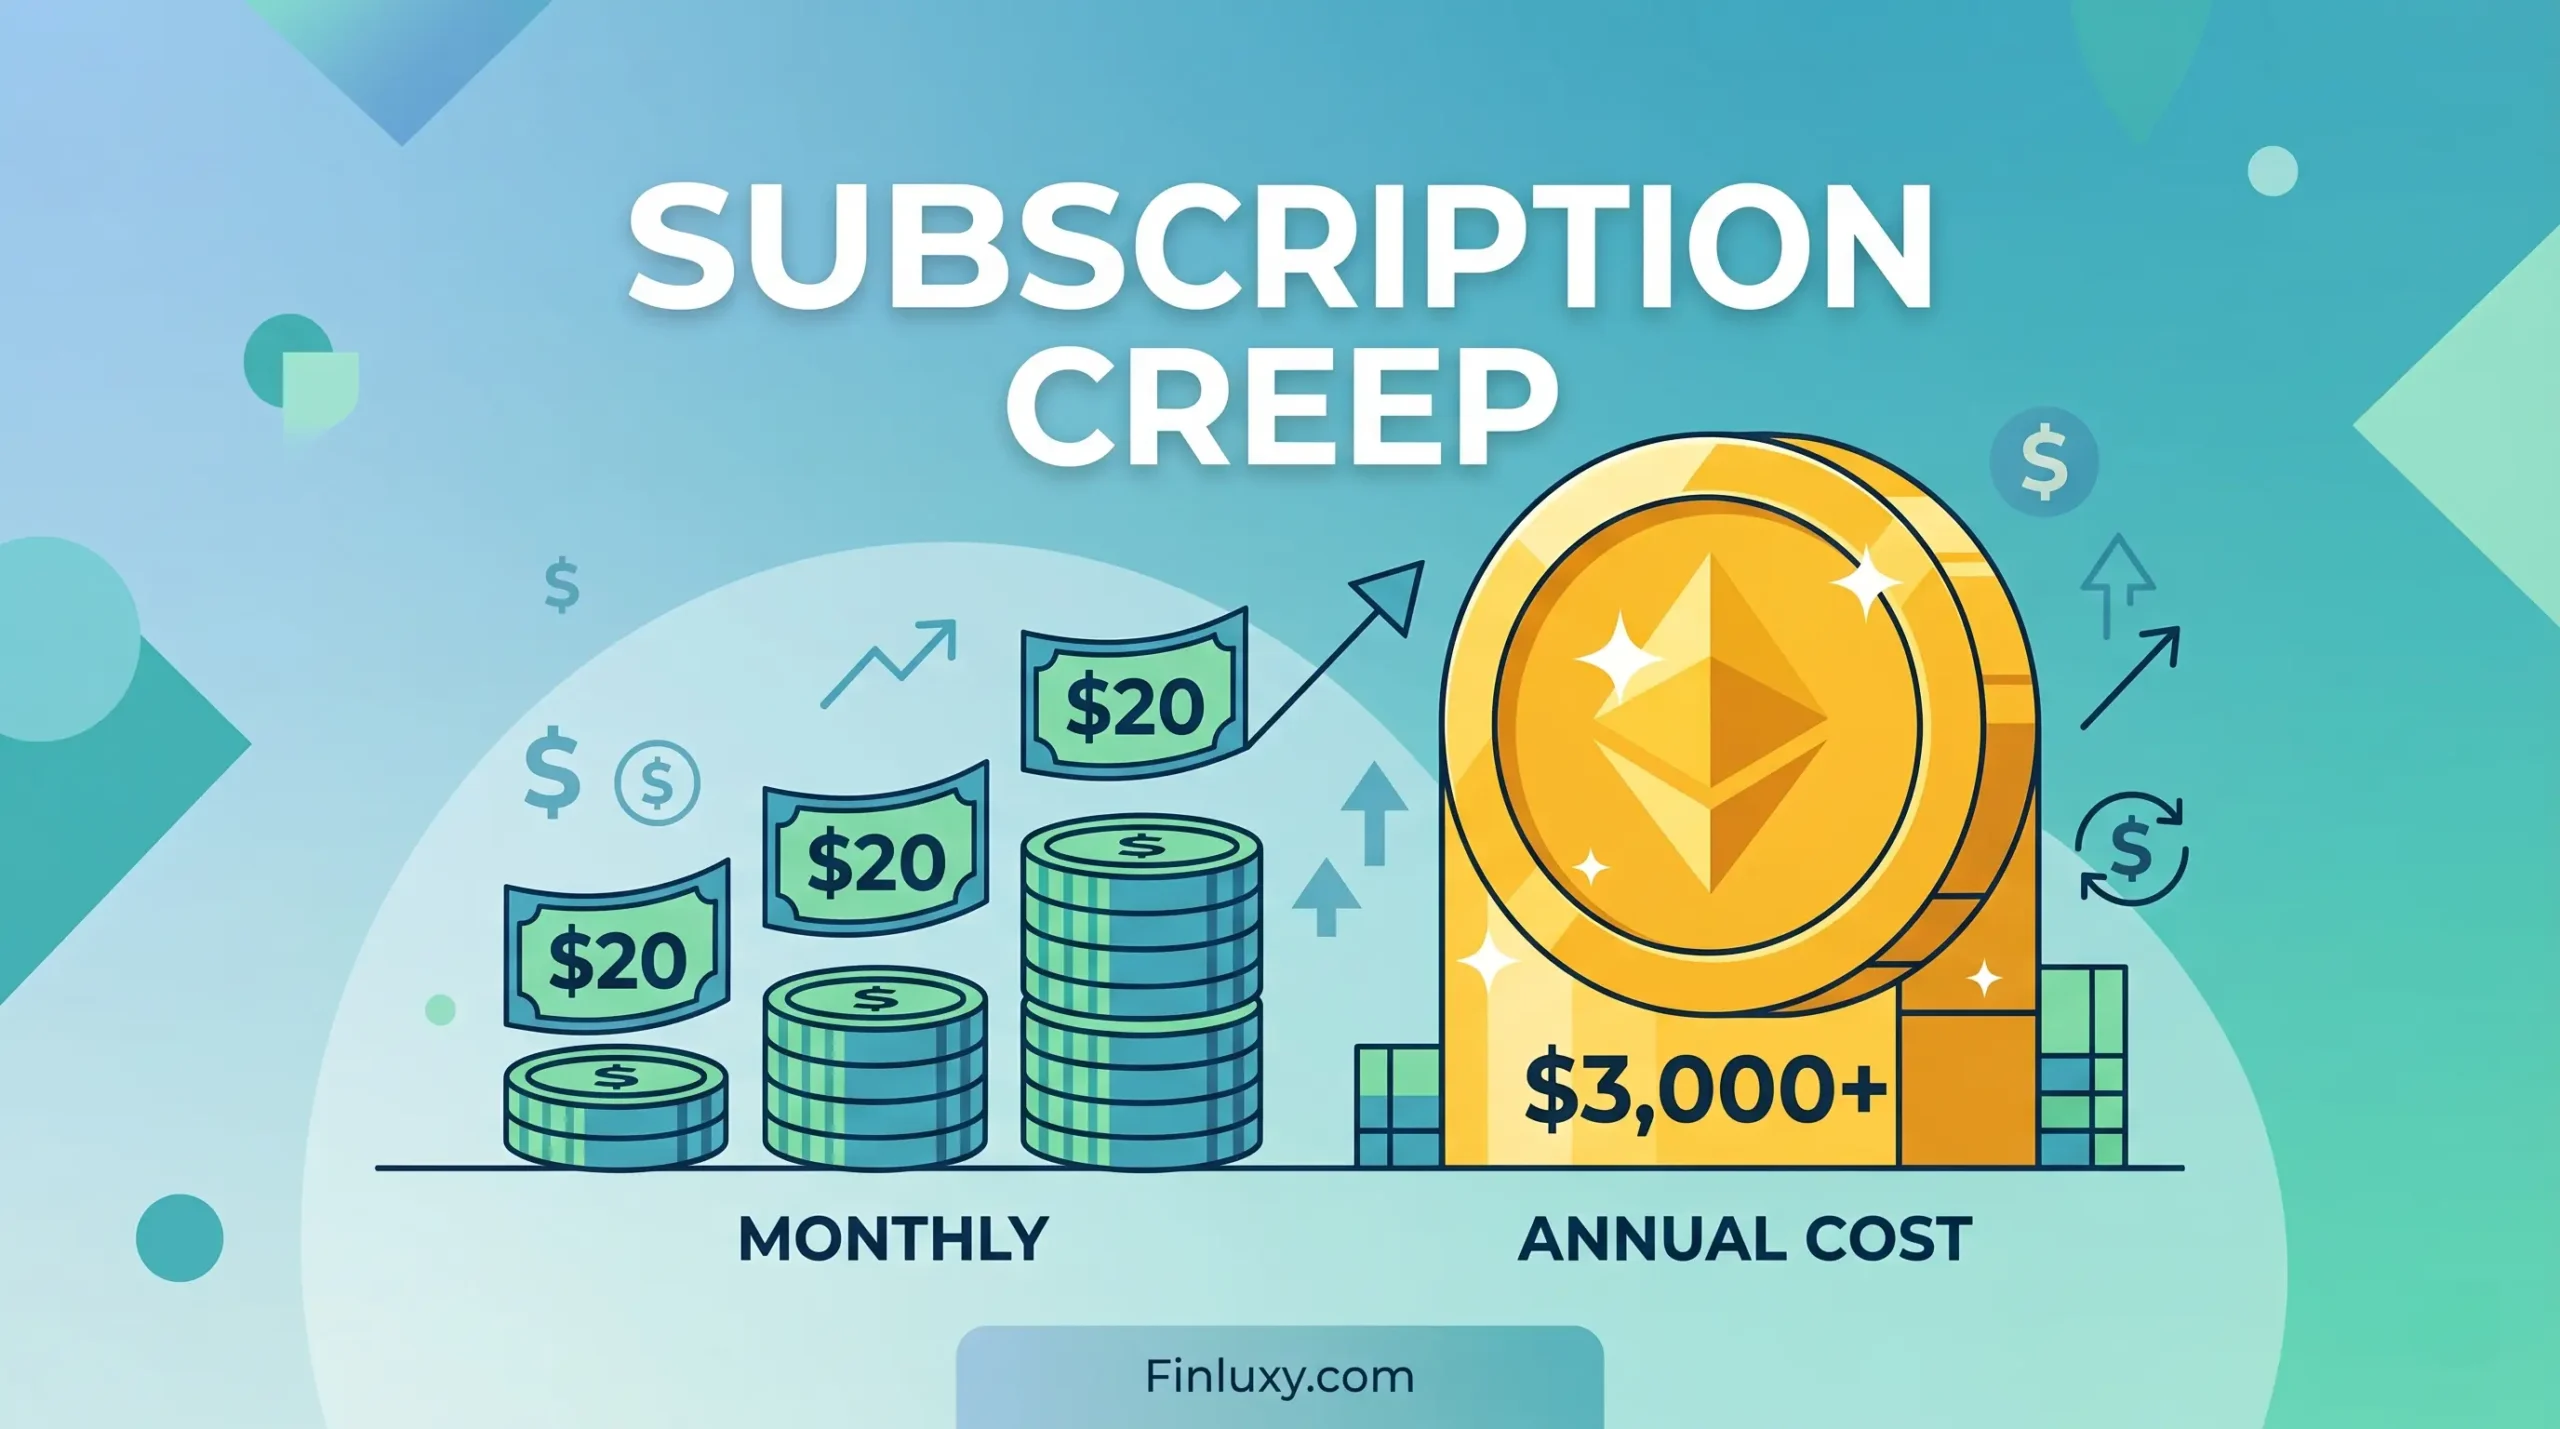
The Bureau of Labor Statistics puts 2024 spending on audio and visual equipment and services at $1,444 per year for households in the highest income quintile — the group earning above roughly $155,925, per the BLS Consumer Expenditure Survey released in early 2026. That figure undercounts what a typical high earner actually pays, because it excludes software, news, wellness apps, and the curated boxes that quietly autorenew. Stack those together and the real number climbs past $3,000 fast. The math is unforgiving precisely because no single charge feels large enough to question.
Consider the arithmetic that gives this article its title. A subscription stack — the full set of recurring charges a household carries across streaming, software, audio, news, and wellness — built from charges averaging $20 each crosses $3,000 annually at roughly 12.5 services. Most $150k+ households carry more than that and don’t know it.
Scope: This analysis covers consumer subscription spending for U.S. households earning $150k+, using service pricing verified against company sources as of June 2026 and household spending data from the BLS Consumer Expenditure Survey for 2024 (the most recent release). Streaming prices change frequently — Netflix, HBO Max, Spotify, and Amazon Prime Video all adjusted U.S. pricing between October 2025 and March 2026 — so verify current rates before acting. The BLS audio-video category does not isolate streaming from equipment, and no government source itemizes a household’s full cross-category subscription stack; figures combining categories are modeled and labeled as such. This is cost analysis, not financial advice.
The numbers that should anchor your audit
Five figures frame the entire problem. Read them before the breakdown, because each one reframes how the next section reads.
| Figure | Value | Source & period |
|---|---|---|
| Highest-quintile audio/video equipment & services spend | $1,444/year | BLS CE Survey, 2024 |
| Average household total entertainment spend | $3,609/year | BLS CE Survey, 2024 |
| Average household streaming spend | ~$69/month | Deloitte Digital Media Trends, March 2026 |
| Share who would cancel on a $5 price increase | 61% | Deloitte Digital Media Trends, March 2026 |
| Subscriptions at ~$20 each to reach $3,000/year | ~12.5 services | Finluxy calculation |
Sources: BLS Consumer Expenditure Survey (2024, released February–March 2026); Deloitte Digital Media Trends report (March 2026). Audio/video figure reflects the 81st–100th income percentile.
Note the gap between the BLS audio-video figure of $1,444 and Deloitte’s ~$69 monthly streaming estimate, which annualizes to roughly $828. The two measure different baskets — BLS folds in equipment and one-time purchases while excluding some bundled-app spending — and neither captures software or news. A genuine average household subscription spend across all categories sits above either number once you total the receipts.
Where a $20/month habit actually goes
Streaming is the visible layer, and it has gotten more expensive on a schedule. Netflix raised every U.S. tier in late March 2026: Standard with Ads to $8.99, Standard to $19.99, and Premium to $26.99, according to Reuters reporting on the company’s published rates. HBO Max moved first, lifting all three plans effective November 2025 — Basic with Ads to $10.99, Standard to $18.49, Premium to $22.99 — per Warner Bros. Discovery’s announcement covered by Variety. The pattern repeats across the category because it works: 68% of subscribers now sit on ad-supported tiers, Deloitte reported in March 2026, which lets platforms raise headline prices while steering price-sensitive users toward cheaper plans that carry advertising revenue.
Audio follows the same trajectory. Spotify raised U.S. prices in January 2026, with the increases hitting existing subscribers across their February and March billing cycles: Premium Individual at $12.99, Duo at $18.99, and Family at $21.99 per month. Stack a single Netflix Premium plan against Spotify Individual and you are at $39.98 monthly — $479.76 a year — for two services most households treat as background utilities. The detailed mechanics of a streaming subscription stack true cost show how quickly the secondary services compound that base.
Bundles complicate the picture rather than simplifying it. Apple One lists at $19.95 for Individual, $25.95 for Family, and $37.95 for Premier per month on Apple’s own pricing page as of June 2026. The Premier tier folds in Apple Music, TV+, Arcade, News+, Fitness+, and 2TB iCloud — genuinely cheaper than buying all six separately, but only if you use all six. Most subscribers use two or three, which inverts the savings logic. Running the Apple One vs individual apps comparison against your actual usage is the only way to know which side of the line you fall on.
Then there is the category most people forget to count. Amazon Prime runs $139 per year or $14.99 monthly, unchanged since 2022 per Amazon’s listing, but the April 2026 introduction of Prime Video Ultra at $4.99/month moved 4K streaming behind a new paywall — a price increase achieved without touching the headline number. That technique, raising effective cost by unbundling features rather than lifting the sticker, is the quiet engine of subscription creep. Mapping the Amazon Prime true annual cost means counting these add-ons, not just the membership line.
A modeled stack for a $150k+ household
Numbers in the abstract don’t drive cancellations. A specific stack does. The table below models a plausible — not extreme — set of recurring charges for a dual-income household earning $150k+, using verified June 2026 pricing. Every figure traces to a company source confirmed above.
| Service | Plan | Monthly | Annual |
|---|---|---|---|
| Netflix | Premium | $26.99 | $323.88 |
| HBO Max | Standard | $18.49 | $221.88 |
| Spotify | Family | $21.99 | $263.88 |
| Apple One | Premier | $37.95 | $455.40 |
| Amazon Prime | Annual | $11.58 | $139.00 |
| News (single outlet) | Digital | ~$25.00 | ~$300.00 |
| Fitness app | Annual | ~$13.00 | ~$155.00 |
| Cloud storage / software (assorted) | Mixed | ~$30.00 | ~$360.00 |
| Total | ~$184.99 | ~$2,219.04 |
Sources: Netflix (Reuters, March 2026); HBO Max (Variety/WBD, November 2025); Spotify, Apple, Amazon company pricing (June 2026). News, fitness, cloud, and software lines are category estimates, not verified single-product prices — apply your own receipts. Figure unavailable at publication for a universal news/software figure; ranges reflect segment averages.
That stack reaches roughly $2,219 before counting a second streaming service, a meditation app, a password manager, a meal-box trial that never got canceled, or the professional software a remote worker expenses to themselves. Add three or four of those and $3,000 arrives without a single purchase that felt indulgent. The software subscription annual audit tends to surface the biggest surprises here, because business-tool charges hide inside the same statement as entertainment.
The Finluxy Subscription Efficiency Score
Cost alone doesn’t tell you whether a stack is wasteful — utilization does. The Finluxy Subscription Efficiency Score divides the estimated à la carte value of benefits you actually use by total annual subscription cost, times 100. Above 100 means you extract more value than you pay; below 100 means the reverse. The metric only works if you’re honest about utilization rate — the share of a subscription’s features you genuinely use.
| Scenario | Annual cost | À la carte value used | Finluxy Subscription Efficiency Score |
|---|---|---|---|
| High-utilization household (uses most of each service weekly) | $2,219 | $3,100 | 139.7 |
| Average household (regular use of half the stack) | $2,219 | $2,050 | 92.4 |
| Low-utilization household (two services carry the value) | $2,219 | $1,180 | 53.2 |
Finluxy proprietary metric. À la carte value estimated as the standalone price of equivalent benefits actually consumed; cost base from the modeled stack above (~$2,219/year). Illustrative usage scenarios.
The average household scores 92.4 — below break-even. That household isn’t being reckless; it’s paying for a stack assembled one reasonable decision at a time, where the aggregate quietly stopped earning its keep. The score above 150 only appears when nearly every service gets used at near-full value, which is rare across a stack of eight or more. Before canceling anything, it’s worth working through how to value each subscription so the score reflects real consumption rather than guesswork.
What most coverage misses
The standard advice — “cancel what you don’t use” — targets the wrong failure mode. The BLS data points to a subtler problem. Audio and visual equipment and services spending for the highest income quintile actually fell from $1,580 in 2022 to $1,444 in 2024, per the BLS Consumer Expenditure Survey. High earners are not adding streaming services recklessly; that line is declining. Subscription creep at this income level isn’t about more streaming. It migrated to categories BLS doesn’t isolate: software, professional tools, wellness apps, and news. The visible category shrank while the invisible ones grew, which is exactly why a household feels frugal about Netflix while its total subscription spend rises.
That displacement matters for auditing. A household that benchmarks itself against the $1,444 audio-video figure will conclude it’s doing fine and stop looking — precisely when the growth has moved to the lines that figure never measured. The most productive audit ignores streaming first and starts with the recurring charges that don’t announce themselves as “subscriptions” at all.
Practical context for the $150k+ household
At $150k+, the instinct is to treat $20 monthly charges as beneath attention — a rounding error against the household budget. The BLS framing argues otherwise. The highest income quintile spent an average of $150,342 in total 2024 expenditures; a $3,000 subscription stack is 2% of that, and unlike housing or transportation, nearly all of it is discretionary and reversible. The relevant threshold isn’t whether you can afford the charges. It’s whether the marginal subscription clears a Finluxy Subscription Efficiency Score of 100 — whether the value extracted justifies the cost, given that the opportunity cost at this income is a maxed retirement contribution or a brokerage deposit, not skipped groceries.
The trade-off worth modeling is the renewal default. Deloitte found 61% of consumers would cancel a service over a $5 price increase, yet most don’t, because automatic renewal removes the decision point entirely. A household serious about this sets one annual review — pull twelve months of statements, flag every recurring charge, score each against actual use, and let anything below break-even lapse. An automatic renewal audit catches the charges that survive purely on inertia, and the structured subscription audit guide gives the full method. For households comparing their position against lower income brackets, the middle-income household subscription stack shows how the same creep behaves on a tighter budget — the dollar amounts shrink but the efficiency problem doesn’t. The decision isn’t to live without subscriptions. It’s to make the renewal an active choice once a year instead of a passive one twelve times.
How much do $150k+ households actually spend on subscriptions per year?
No government source itemizes a complete cross-category subscription total. The BLS Consumer Expenditure Survey (2024) shows the highest income quintile spent $1,444 on audio and visual equipment and services, but that excludes software, news, and wellness apps. Once those are added, a typical high-earner stack commonly exceeds $3,000 annually based on verified per-service pricing.
What is a good Finluxy Subscription Efficiency Score?
A score of 100 is break-even — you extract exactly what you pay. Above 150 indicates an efficient stack where used value substantially exceeds cost. Below 100 means cost exceeds the value you actually consume, which is the signal to trim. The modeled average household above scored 92.4, below break-even.
Why does my streaming bill keep rising when I haven’t added services?
Per-tier price increases and feature unbundling. Netflix raised all U.S. tiers in March 2026 (Reuters), HBO Max in November 2025 (Variety), and Spotify in January 2026. Amazon moved 4K streaming behind a new $4.99 Prime Video Ultra add-on in April 2026 — an effective increase achieved without changing the membership price.
Is a bundle like Apple One Premier worth it?
Only if you use most of the bundled services. Apple One Premier costs $37.95/month (Apple, June 2026) for six services. It beats à la carte pricing when all six get used, but most subscribers use two or three, which erases the discount. Score it on the services you actually consume, not the full list.
Methodology
Service prices were verified against primary company sources or contemporaneous reporting of company-published rates as of June 2026: Netflix via Reuters’ March 2026 coverage of Netflix’s posted U.S. pricing; HBO Max via Variety’s reporting on Warner Bros. Discovery’s November 2025 increase; Spotify, Apple, and Amazon via each company’s own pricing pages. Household spending figures come from the BLS Consumer Expenditure Survey for 2024, released February–March 2026, including the audio/video equipment and services line for the highest income quintile retrieved via the Federal Reserve Economic Data series, and total expenditure figures from the BLS news release. Streaming behavior data is from Deloitte’s Digital Media Trends report (March 2026). The modeled stack combines verified single-service prices with category estimates for news, fitness, cloud, and software — those four lines are segment approximations, not verified point prices, and are labeled as such. The Finluxy Subscription Efficiency Score is calculated as (estimated à la carte value of benefits actively used ÷ total annual subscription cost) × 100. Where a precise universal figure was unavailable — such as a single representative news or software subscription price — ranges based on segment averages were used rather than a fabricated point figure. Per BLS guidance, detailed entertainment subcategory estimates carry higher variance due to limited reporting and are treated as directional.
Sources & References
- BLS Consumer Expenditure Survey 2024 — household spending by income quintile and category
- FRED / BLS — audio and visual equipment and services spending, highest income quintile
- Reuters — Netflix U.S. price increase, March 2026
- TV Guide / Warner Bros. Discovery — HBO Max 2026 plan pricing
- Apple — Apple One bundle pricing
- Amazon — Prime membership pricing
- CNBC / Deloitte — Digital Media Trends streaming behavior, March 2026