 Analysis by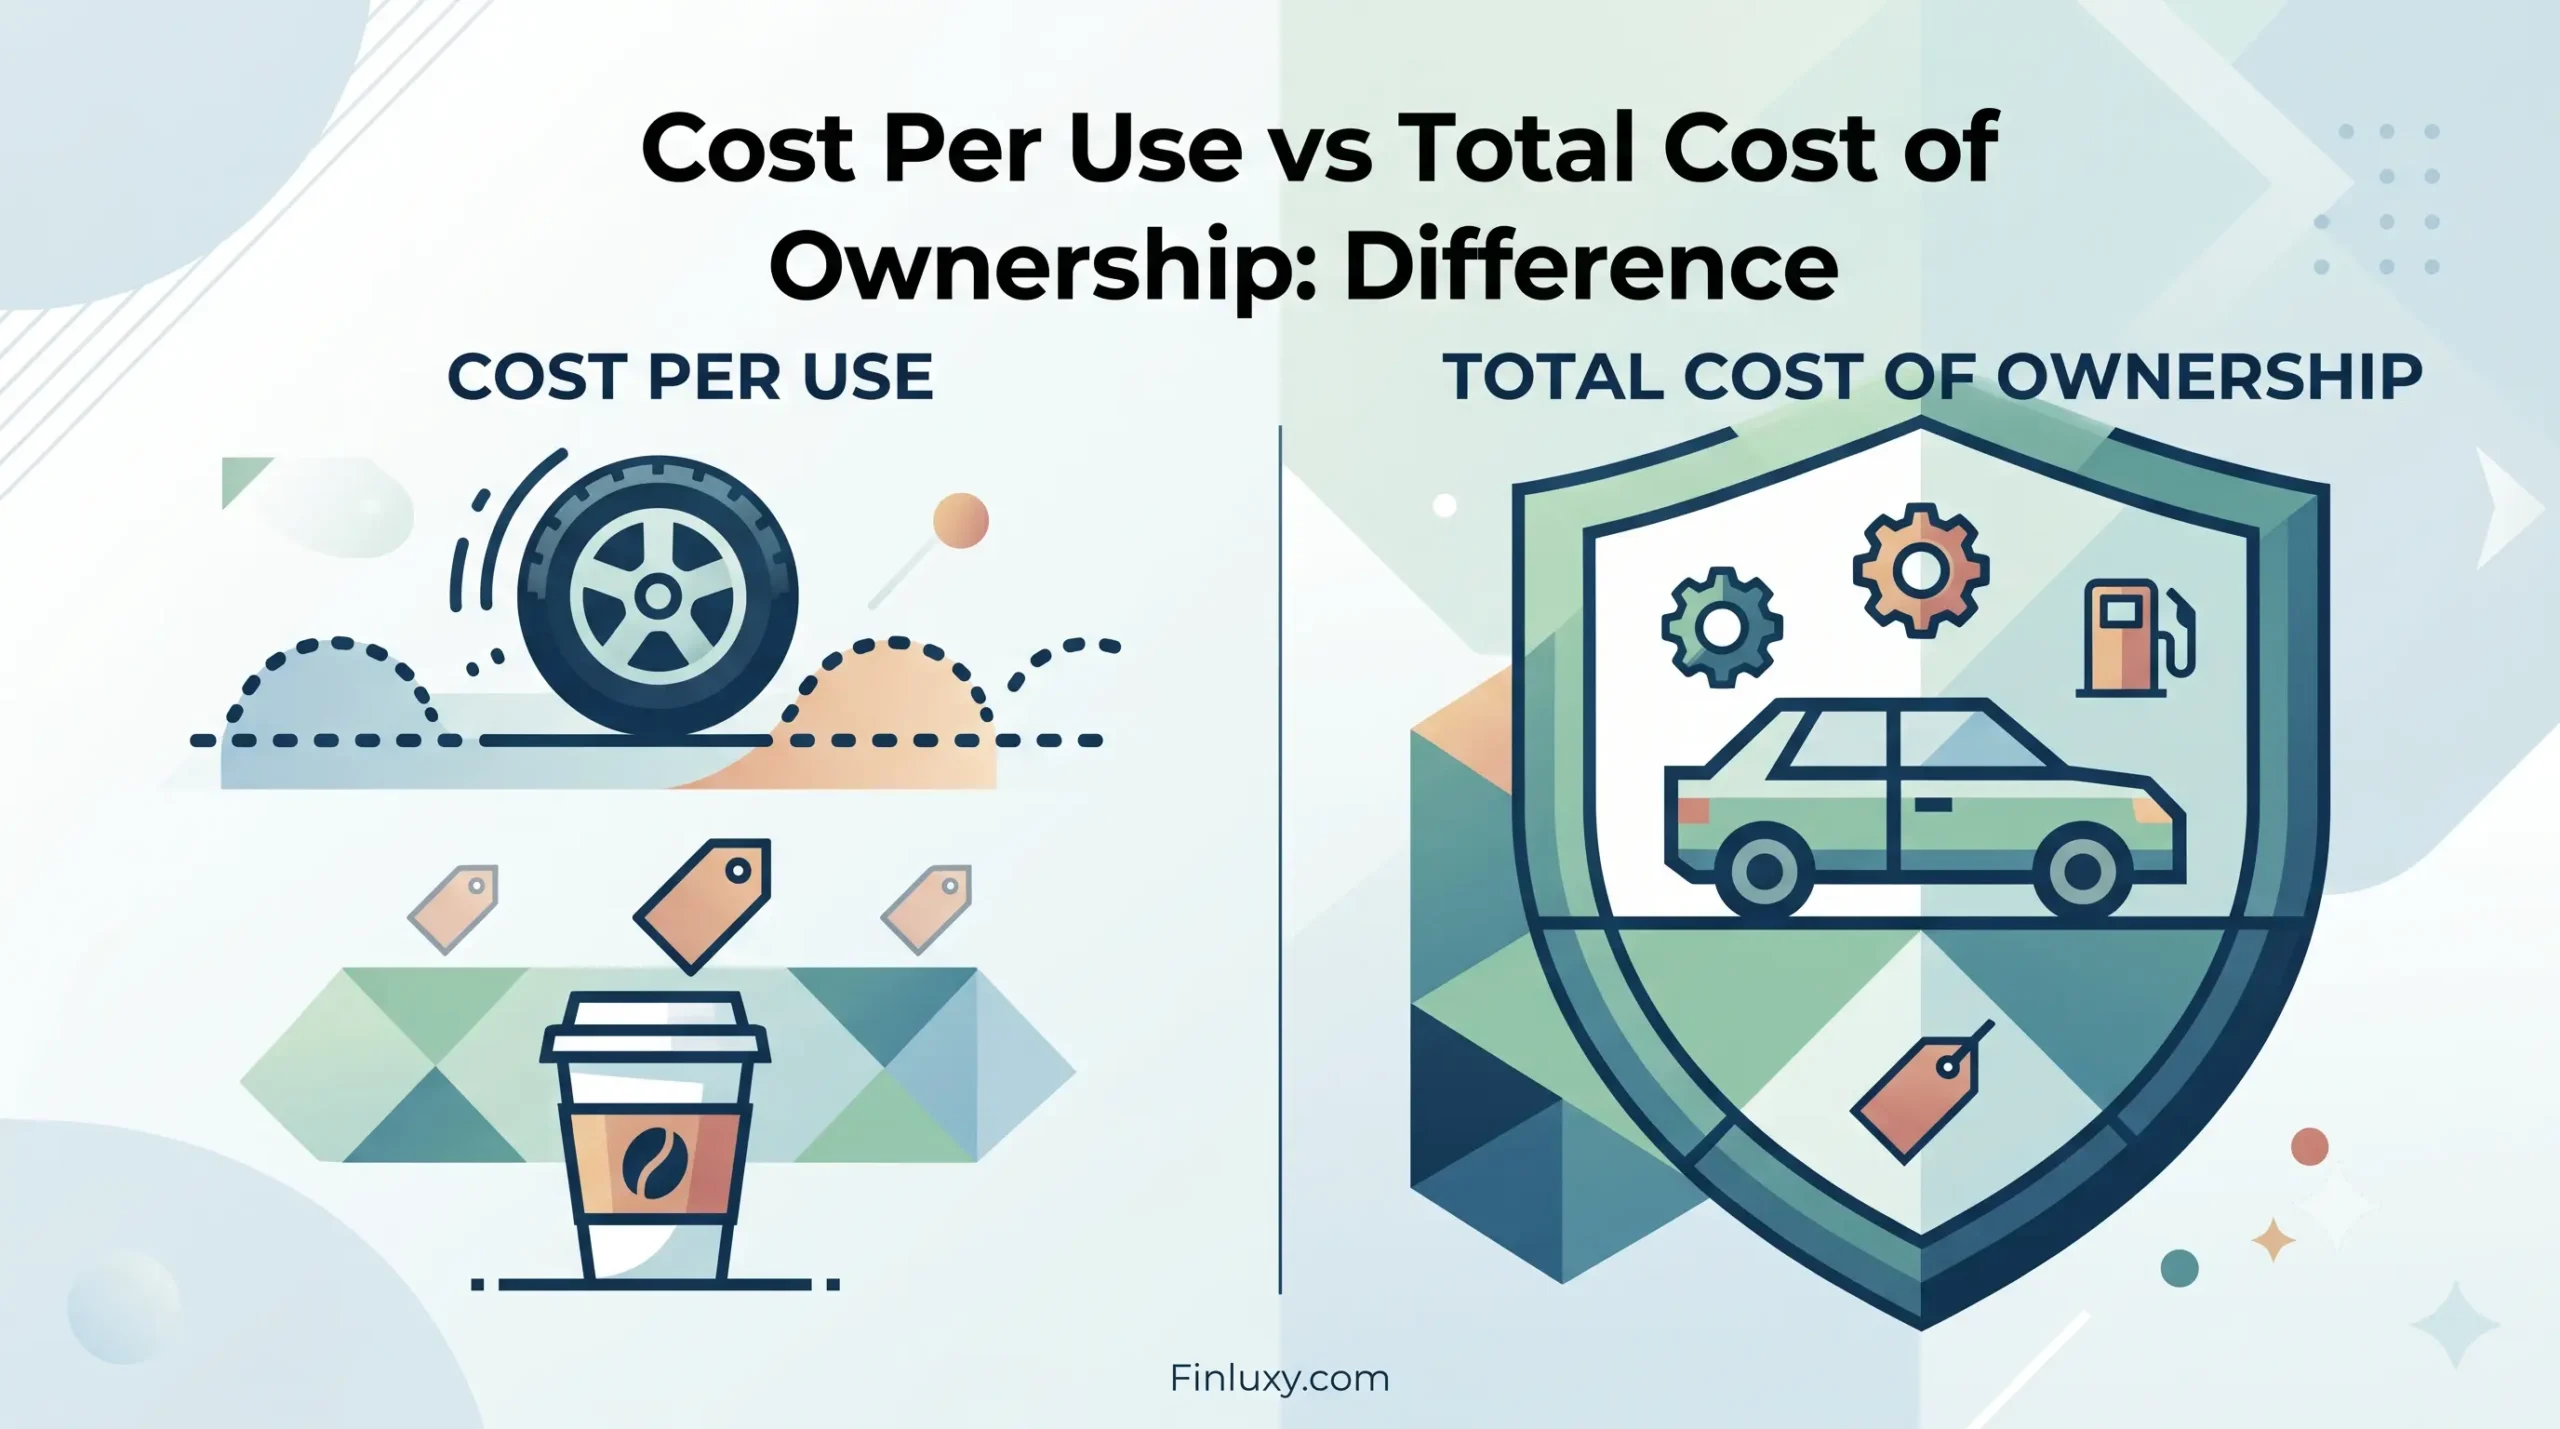
A Peloton Bike costs $1,695 today. Its total cost of ownership over three years runs roughly $4,500 once membership and accessories are counted — yet its cost per use can land under $4 a session if you actually ride it. Those two numbers describe the same purchase and lead to opposite conclusions, which is exactly why confusing them costs money.
Total cost of ownership answers “what will this drain from my accounts before I’m done with it.” cost per use answers “what does each instance of value cost me.” One is a liability question. The other is an efficiency question. Most buyers run the first calculation, feel the sticker shock, and never run the second — or run the second, feel reassured, and ignore the first. The gap between them is where $150k+ households either justify a premium or talk themselves into a depreciating object they touch twice a month.
Scope: This analysis compares two cost-evaluation methodologies using durable consumer goods — primarily connected fitness equipment — as the worked example. Pricing reflects manufacturer-published figures as of June 2026 and membership rates effective October 2025; residual values are directional estimates from secondary resale-market data, not appraisals. Usage frequency draws on Bureau of Labor Statistics (BLS) American Time Use Survey 2024 participation data and stated assumptions, not individual tracking. Figures are illustrative of method, not personalized projections. This is cost analysis, not financial or purchasing advice.
The two numbers, defined precisely
Total cost of ownership (TCO) is the sum of every dollar a purchase extracts across a defined holding period: acquisition price, recurring fees, maintenance, consumables, financing cost, and disposal or transaction costs — minus residual value recovered at the end. It is a cumulative figure expressed in dollars. The full cost per use calculation method shares most of those inputs but divides by something TCO ignores entirely: how many times you actually used the thing.
cost per use takes that same net outlay and divides by total uses over the holding period. The formula this cluster uses: (purchase price − residual value after N years + cumulative recurring costs over N years) ÷ total uses over N years. The numerator is essentially TCO. The denominator is the part that turns a scary cumulative number into a per-instance number — and the part that makes an expensive object look either brilliant or absurd depending entirely on behavior.
Here is the distinction that matters: TCO is fixed by the product and your contract terms. cost per use is governed by you. Two households can own identical equipment with identical TCO and report cost per use figures that differ by an order of magnitude. The product didn’t change. The denominator did.
| Figure | Value |
|---|---|
| Purchase price (Bike) | $1,695 |
| All-Access membership, 36 months | $1,800 |
| Total cost of ownership (3 yr, net of residual) | $3,395 |
| cost per use at 3 sessions/week | $7.25 |
| cost per use at 1 session/week | $21.76 |
Source: Peloton published pricing, onepeloton.com (June 2026); All-Access membership $49.99/mo effective October 2025 (CNBC, Oct 2025). Residual value estimated at $800 from secondary-market listings. cost per use is author-calculated; methodology in notes below.
Watch the same purchase split into two stories
Take the current Peloton Bike at $1,695. All-Access membership runs $49.99 per month as of October 2025, up from the $44 it charged before the autumn 2025 price revision — $1,800 across 36 months. Assume a residual value of roughly $800 at year three, consistent with completed secondary-market listings for used bikes. Net outlay: $1,695 + $1,800 − $800 = $2,695, plus call it $700 in shoes, mat, and a heart-rate strap that don’t come back. TCO lands near $3,395.
That $3,395 is the entire TCO story. It does not care whether the bike becomes a clothes rack. Now introduce the denominator. Ride three times a week for three years — 468 sessions — and cost per use is $3,395 ÷ 468 = $7.25 per ride. Ride once a week — 156 sessions — and the same $3,395 becomes $21.76 per ride. Identical TCO. The cost per use tripled because the behavior changed.
| Usage scenario | Total uses (3 yr) | total cost of ownership | cost per use |
|---|---|---|---|
| 3×/week (committed) | 468 | $3,395 | $7.25 |
| 1.5×/week (typical) | 234 | $3,395 | $14.51 |
| 1×/week (lapsed) | 156 | $3,395 | $21.76 |
Source: Author calculation from Peloton pricing (onepeloton.com, June 2026) and All-Access rate (CNBC, Oct 2025). Sessions derived from stated weekly frequency × 156 weeks. TCO constant across scenarios by design — it is behavior-independent.
Notice what the table proves. The TCO column is a flat line. The cost per use column is a staircase. If you only ever looked at TCO, every one of these households made the identical purchase decision and bears the identical cost. That’s true on paper and false in practice — because the lapsed rider is paying nearly $22 to do something a $69-per-month average gym membership (Health & Fitness Association, 2024) delivers at a few dollars a visit for anyone who shows up.
Why the distinction changes which mistake you make
TCO and cost per use catch different errors. Run only TCO and you commit the “cheap thing, used constantly” mistake in reverse — you reject durable, high-utility purchases because the cumulative number looks large, while happily bleeding money on low-TCO items you use rarely. A $30-a-month streaming bundle has trivial TCO and can still be the worst cost per use in your budget if nobody watches it.
cost per use run in isolation has the opposite blind spot. It flatters anything used frequently and quietly ignores the capital you’ve tied up and can’t recover. A vacation home used 40 nights a year can post a defensible annual cost per night stayed while representing a six-figure illiquid position whose TCO — taxes, insurance, maintenance, opportunity cost on the equity — is the number that actually constrains your balance sheet. cost per use says “fine.” TCO says “that’s a lot of capital parked in a depreciating asset you visit six weekends a year.”
The resolution is sequence, not selection. TCO sizes the commitment. cost per use tests whether the commitment earns its keep. You need the first to know if you can afford the thing and the second to know if you should. Skipping either is how a financially capable household ends up with an efficient-looking purchase that was never efficient — the exact failure mode catalogued in purchases that look efficient but aren’t.
The residual value wedge most analyses miss
Here’s what standard coverage of this topic overlooks: residual value sits inside both metrics but does completely different work in each. In TCO, residual value is a credit — it shrinks the cumulative number. In cost per use, residual value shrinks the numerator, which means its impact is amplified or muted entirely by the denominator. A high residual value on something you barely use barely helps your cost per use, because you’re dividing a smaller-but-still-large number by a tiny use count. A high residual value on something you use constantly is almost irrelevant to cost per use, because the denominator is already crushing the figure.
This is why residual value retention matters far more for the cost per use of low-frequency luxury goods than for high-frequency equipment. A Rolex daily cost of ownership analysis lives or dies on residual value, because the watch’s use count is “worn most days” but its acquisition cost is enormous and recoverable. A Peloton’s cost per use barely moves whether it resells for $600 or $1,000, because 468 in the denominator swamps a $400 swing in the numerator — it’s the difference between $7.25 and $8.10. Same $400. Wildly different leverage. Most write-ups treat residual value as a single concept doing a single job. It isn’t.
Finluxy Use-Value Score
The Finluxy Use-Value Score rates whether a purchase delivers cost per use below the category median for its price tier, adjusted for residual value retention. Score = 100 × (1 − (actual cost per use ÷ category median cost per use)), capped at 100, floored at 0. For home fitness, this cluster uses a category median cost per use of $8.40 per session. Below that median, the score climbs toward best-in-class; at the median, 50; above it, toward zero.
| Usage scenario | cost per use | Category median cost per use | Finluxy Use-Value Score |
|---|---|---|---|
| 3×/week (committed) | $7.25 | $8.40 | 14 / 100 |
| 1.5×/week (typical) | $14.51 | $8.40 | 0 / 100 |
| 1×/week (lapsed) | $21.76 | $8.40 | 0 / 100 |
Source: Author calculation. cost per use per scenario from the prior table; home-fitness category median cost per use of $8.40/session per Finluxy Cost Per Use cluster methodology. Score = 100 × (1 − cost per use ÷ 8.40), floored at 0.
The score makes the point the dollar figures only imply. Even the committed three-times-a-week rider scores just 14 — beating the category median, but not by much, because today’s higher hardware price and the $49.99 membership pushed the numerator up versus older Peloton economics. The typical and lapsed riders score zero: they are paying more per session than the median home-fitness option, full stop. A purchase can clear the “I use it a lot” bar and still fail the efficiency bar once the category median is the benchmark rather than your own relief at using it.
Methodology
Pricing for the Peloton Bike ($1,695) was taken from Peloton’s published product pages at onepeloton.com, verified June 2026. The All-Access membership rate of $49.99 per month was confirmed against CNBC reporting on Peloton’s October 2025 price revision, which raised the membership from $44. Gym membership context ($69 average monthly fee, 2024) comes from Health & Fitness Association benchmarking data as aggregated in industry reporting; premium-tier club pricing of $150–$350+ per month reflects Equinox and Life Time positioning from the same secondary sources. Exercise participation context (21.5% of the population aged 15+ engaging in sports, exercise, and recreation on an average day, 2024) is from the BLS American Time Use Survey, released June 2025.
Residual value of approximately $800 at three years is a directional estimate drawn from completed secondary-market resale listings, not a guaranteed figure; resale values vary by model, condition, and region. cost per use, TCO, and the Finluxy Use-Value Score are author-calculated using the formulas stated inline. Where a precise model-specific or period-specific resale figure was unavailable, the analysis uses a stated estimate and flags it rather than presenting a false point value. Figures appearing in both body text and tables were reconciled to match exactly before publication.
What this means for a $150k+ household
At $150k+, neither $3,395 of TCO nor $21.76 per ride is a budget-breaker in isolation — which is precisely the trap. The constraint at this income isn’t affordability; it’s the accumulation of individually-affordable purchases that each fail the cost per use test. Five connected-fitness, hobby, or lifestyle objects at $3,000 TCO apiece is $15,000 committed, and if three of them post lapsed-user cost per use figures, the efficient move was never to optimize the purchase — it was to not make three of them.
Run both numbers before buying, in order. Use TCO to confirm the commitment is one you’d make even if the thing underdelivers — because some fraction of them will. Then estimate cost per use honestly, using your real historical frequency for similar items rather than your aspirational one; the BLS figure that only about one in five adults exercises on a given day (2024) is a useful prior against your optimism. If the cost per use only works at a frequency you’ve never actually sustained, you’re not buying equipment, you’re buying intentions. The households that compound wealth aren’t the ones who avoid premium purchases — they’re the ones who can tell, before the card is charged, which premium clears both bars and which one just clears the one they wanted to look at. The methodology in the smarter purchase evaluation method formalizes running both in sequence, and the head-to-head in Peloton vs gym membership cost per use shows where the bike actually wins.
Is cost per use just total cost of ownership divided by usage?
Mechanically, close — the numerator of cost per use is essentially net TCO (acquisition plus recurring costs minus residual value). The difference is conceptual. TCO is a fixed liability number set by the product and your contract. cost per use introduces a behavioral variable — the use count — that you control and that can swing the result several-fold on an identical TCO. They answer different questions: “what does this cost me to own” versus “what does each use cost me.”
Which metric should I use to decide on a purchase?
Both, in sequence. TCO first, to confirm you’d accept the total commitment even if the item underdelivers. cost per use second, using your realistic usage frequency, to test whether it’s efficient. A purchase that passes TCO but fails cost per use is affordable and wasteful; one that passes cost per use but fails TCO may be efficient per use yet tie up more capital than your balance sheet should carry.
Why does residual value matter more for luxury goods than for equipment?
Because residual value shrinks the cost per use numerator, but its impact depends on the denominator. For low-frequency, high-cost items with strong resale markets — certain watches, handbags — residual value is a large share of a large numerator divided by few uses, so it moves cost per use substantially. For high-frequency equipment, the use count is so large that even a several-hundred-dollar swing in residual value barely changes the per-use figure.
Does a high Finluxy Use-Value Score mean a purchase is “worth it”?
It means the purchase beats the category median cost per use for its price tier at your assumed usage — an efficiency signal, not a verdict on whether you should buy. A high score on something you genuinely use is a strong sign. But the score depends entirely on the usage frequency you input; plug in aspirational numbers and you’ll get an aspirational score. Use your real historical frequency.
Sources & References
- Peloton — Bike product and pricing page ($1,695), verified June 2026
- CNBC — Peloton hardware and membership price changes, All-Access $49.99/mo (October 2025)
- BLS American Time Use Survey — 2024 results, sports/exercise/recreation participation (released June 2025)
- Health & Fitness Association data via Gymdesk — average monthly gym membership $69 (2024)
- Industry pricing context — budget, mid-range, and premium club tiers including Equinox and Life Time