 Analysis by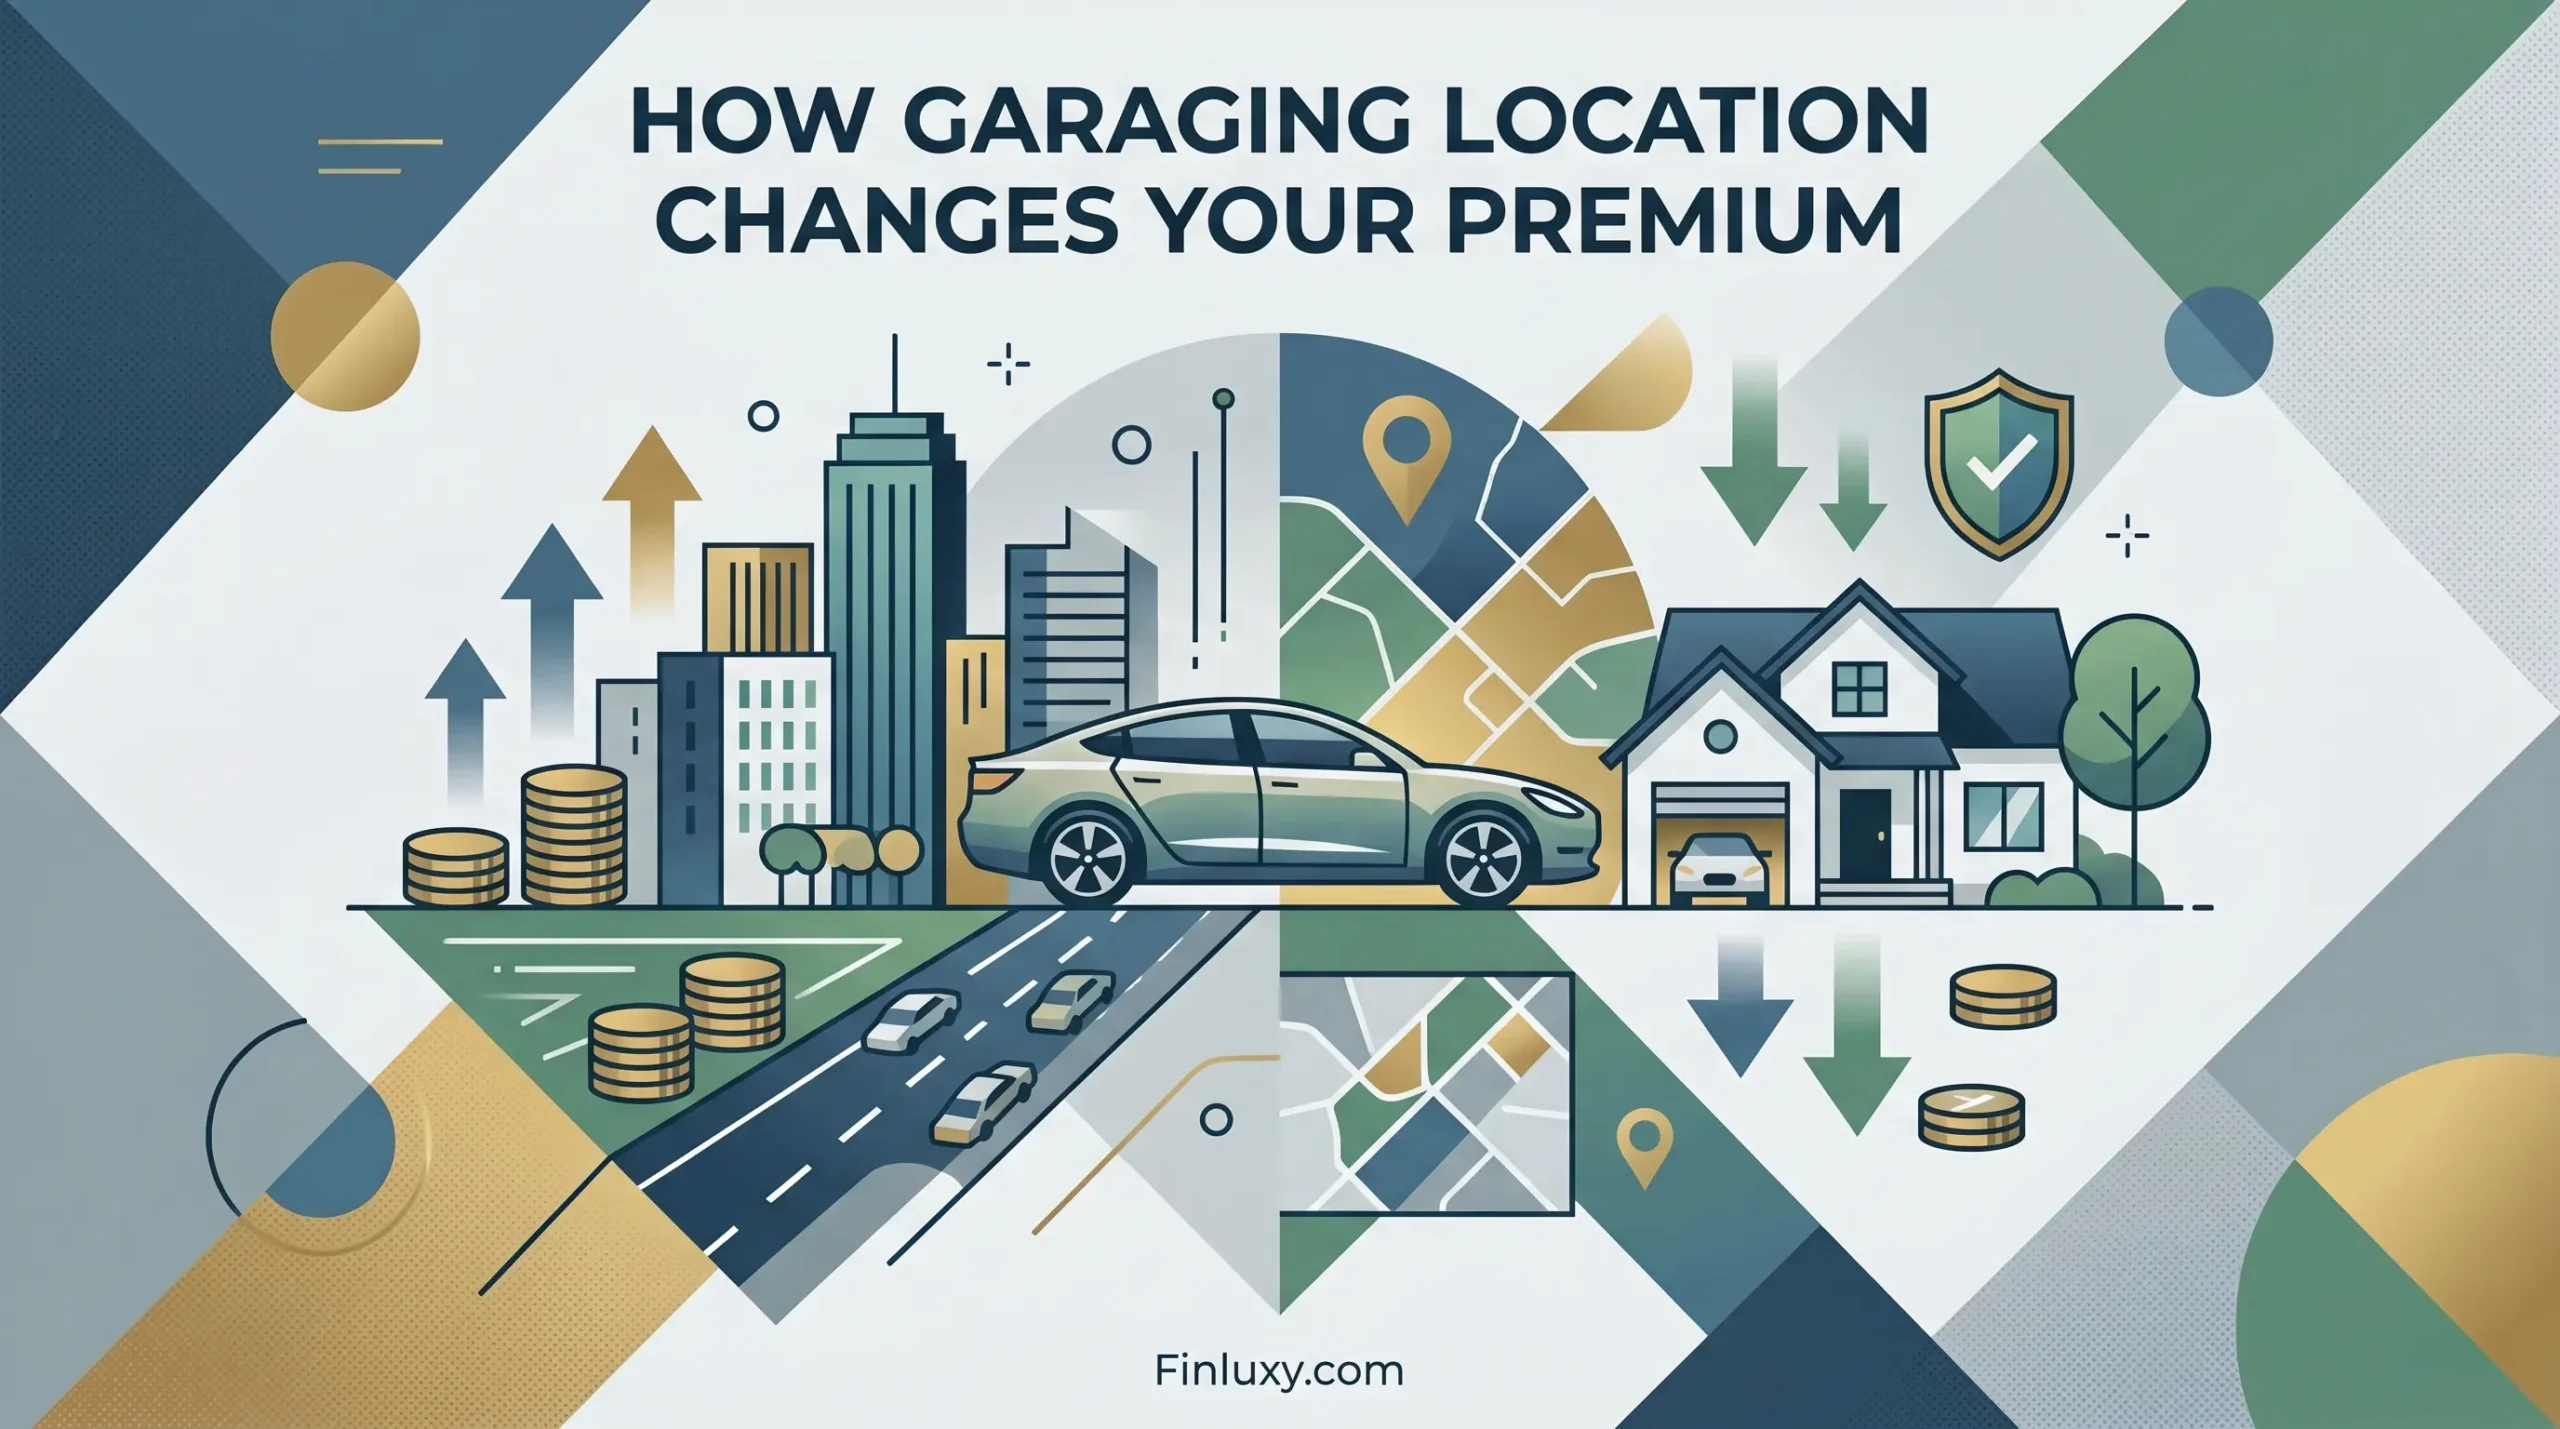
Two identical drivers. Two identical $220,000 cars. Park one in a dense urban ZIP and the other in a low-density suburb ten miles away, and the premium gap can run 30% to 50% on the same coverage limits — sometimes more. The Zebra’s 2025 State of Auto Insurance data put average annual premiums near $1,200 in low-risk rural ZIPs against more than $3,000 in urban high-risk areas — a spread driven entirely by where the car sleeps.
That spread is the single most under-discussed line item in luxury auto coverage. Driver age, model year, and MSRP get the attention. Garaging location quietly does more work than any of them on a high-value vehicle, because the dollar value of every percentage point scales with the asset.
This analysis covers garaging-location effects on personal auto premiums for vehicles in the $100,000–$500,000 range, using 2025–2026 benchmark data from The Zebra, Insurify, MoneyGeek, and the Insurance Information Institute (III). Location effects are highly carrier- and state-specific; the ranges here describe national patterns, not quotes for any individual ZIP. Two states — California and Michigan — restrict ZIP-based rating by law, so the patterns below do not apply uniformly there. Specialty collector policies price location differently from standard carriers; both are addressed separately. Figures are national averages and segment estimates, not model-specific quotes.
The numbers that matter
Here is the location story in five figures, before the detail.
| Metric | Figure | Source / Period |
|---|---|---|
| Premium swing from ZIP alone, identical profile | 30%–50% | Covera rate-filing analysis, 2026 |
| Urban vs. rural average annual premium | ~$1,200 vs. $3,000+ | The Zebra, 2025 |
| Metro vs. nearby rural premium gap | 35%–80% | MoneyGeek study, 2025 |
| Texas example: Dallas urban vs. rural ZIP | $2,046 vs. $1,195 (71%) | MoneyGeek, 2025 |
| States prohibiting ZIP as primary rating factor | 2 (California, Michigan) | Prop 103 (1988); MI reform (2020) |
Sources: The Zebra State of Auto Insurance 2025; MoneyGeek 2025; Covera rate-filing analysis 2026; California Proposition 103; Michigan auto reform (2020).
Why location moves the needle harder on expensive cars
Insurers set a base rate off the garaging ZIP, then adjust up or down for everything else. CarInsurance.com describes the garaging ZIP as the first step in pricing — the foundation, not a modifier. Three risk pools feed it: accident frequency, theft and vandalism rates, and the local cost of repairs and medical and legal claims.
For a luxury vehicle, two of those three pools hit harder than they would on a commuter car. Theft loss on a $200,000 exotic is a six-figure comprehensive exposure, so a ZIP with elevated theft rates carries far more weight in the comprehensive component than it would for a $30,000 sedan. Repair-cost geography compounds it — imported parts, specialist labor, and longer cycle times mean a fender-bender in a high-cost metro generates a claim several multiples larger than the same incident in a low-cost area. ValuePenguin reports that roughly 60% of replacement parts are imported, which is why repair-cost differences between regions show up directly in premiums.
The percentage spread stays roughly constant across price tiers, but the dollar consequence does not. A 40% location swing on a $1,800 commuter premium is $720. The same 40% swing on a $9,000 exotic premium is $3,600 — every year, indefinitely. The math behind that gap is the same logic that drives deductible decisions on high-value claims: percentages are cheap to ignore until they sit on top of a large base.
Not every coverage component responds to garaging location equally. The framework below breaks an exotic premium into its parts and flags which ones the ZIP actually moves.
| Coverage component | Share of total premium (typical) | Location sensitivity | Why |
|---|---|---|---|
| Liability | 25%–35% | High | Local accident frequency, legal and medical claim costs vary sharply by area |
| Collision | 30%–40% | High | Traffic density and local repair costs drive frequency and severity |
| Comprehensive | 15%–25% | Very high | Theft, vandalism, and weather exposure are intensely ZIP-specific |
| Uninsured/underinsured motorist | 5%–12% | Moderate–High | Tracks the local uninsured-driver rate |
| Umbrella policy rider (if applicable) | Varies | Low | Priced on assets and liability limits, not garaging ZIP |
Component shares are segment estimates synthesized from Insurify and The Zebra vehicle-class benchmarks (2025–2026); individual policies vary by carrier, limits, and deductible.
Comprehensive is the component to watch on a high-value car. It is the smallest slice of the premium on most vehicles but the most location-sensitive, and on an exotic it protects the largest single exposure — theft of the whole asset. A garaging ZIP with elevated theft statistics can inflate the comprehensive line well beyond what the same ZIP would do to a mid-market car. The uninsured-motorist line follows local conditions too; the cost-driver math there overlaps with what an umbrella policy for car owners is built to backstop.
The Finluxy Insurance Cost Ratio across locations
The Finluxy Insurance Cost Ratio — annual total premium divided by current market value, times 100 — strips out vehicle price and lets you compare insurance burden across cars and ZIPs on equal footing. A standard luxury vehicle through a mainstream carrier typically lands in the 1.5%–2.5% band. The same car through a specialty insurer, or a collector vehicle on an agreed-value policy, often runs lower despite a higher sticker.
Location is one of the largest swing factors inside that ratio. Below, a single $220,000 vehicle is modeled across three garaging scenarios, holding driver profile and coverage constant. The premium figures are segment estimates anchored to the urban/rural spreads in the verified data, not carrier quotes.
| Garaging scenario | Estimated annual premium | Current market value | Finluxy Insurance Cost Ratio |
|---|---|---|---|
| Low-density suburb, standard carrier | $3,500 | $220,000 | 1.6% |
| Dense urban ZIP, standard carrier | $5,300 | $220,000 | 2.4% |
| Same urban ZIP, specialty/agreed-value (limited use) | $2,640 | $220,000 | 1.2% |
Premium figures are segment estimates derived from The Zebra (2025) and MoneyGeek (2025) urban/rural spreads applied to a high-value-vehicle base; the specialty/agreed-value figure mirrors the Cluster Brief benchmark for a comparably valued collector vehicle through Hagerty. Model-specific carrier quotes were not available for this period. Ratios calculated as premium ÷ market value × 100.
The pattern is the headline: moving the same car from a low-density suburb to a dense urban ZIP pushes the ratio from roughly 1.6% to 2.4% — a 50% jump in insurance burden with no change to the car or the driver. Routing the urban-garaged car through a specialty limited-use policy can pull the ratio below the suburban standard-carrier figure entirely. That last row is the lever most owners never pull. Owners weighing it should compare it against the structural differences laid out in agreed value versus stated value coverage.
Where the law caps the location penalty
Two states break the national pattern. California’s Proposition 103, passed by voters in 1988, prohibits territorial rating as the primary driver of premiums. Rates must be based first on three mandatory factors — driving safety record, annual mileage, and years of driving experience — with ZIP-linked factors weighted below them. Michigan enacted comparable restrictions on ZIP-based rating in its 2020 auto reform.
For a $150k+ owner, the practical effect in those two states is a compressed location penalty, not its elimination. Insurers there lean harder on record, mileage, and vehicle factors. Everywhere else, garaging ZIP remains one of the most powerful inputs in the rate filing — which is exactly why some owners with a second property weigh which address legitimately serves as the primary overnight location. That decision has to be real: the garaging address must be where the car actually sits overnight. Best Money notes that misrepresenting the garaging location is insurance fraud and grounds for claim denial.
How specialty insurers treat location differently
Standard carriers price the garaging ZIP as a daily-exposure problem: the car is assumed to be on the road, in traffic, accumulating risk every day. Specialty collector insurers start from a different premise. Hagerty rates limited-use vehicles as occasional-use assets and prices accordingly — which is why a collector policy can run a fraction of a daily-driver premium on the same car.
Location still matters to a specialty insurer, but the channel shifts. The concern moves from accident frequency toward storage security and theft exposure. Car Talk’s review of Hagerty notes the insurer is more cautious about vehicles parked outside than those in an enclosed structure, because open parking raises theft and weather risk. The ZIP’s theft profile feeds the comprehensive line, but the daily traffic-density penalty that dominates standard pricing largely falls away. An urban-garaged exotic that triggers a steep surcharge with a mainstream carrier may price far more gently on an agreed-value limited-use policy — provided it qualifies as limited-use and sits in secure storage. The trade-offs between the two specialty routes show up clearly in a Hagerty versus Chubb comparison, and storage specifics drive a separate pricing question covered under collector car storage insurance rates.
What most coverage overlooks
The standard advice treats garaging location as fixed — your home is your home, and the ZIP penalty is something you absorb. The data points somewhere more specific: the location penalty is not uniform across the premium, it concentrates in comprehensive and collision, and those are precisely the two components a specialty limited-use policy reprices most aggressively.
That means the highest-leverage move for an urban-garaged high-value car is rarely shopping standard carriers against each other for a 10% delta. It is qualifying the vehicle for a structure that reprices the location-sensitive components entirely. The MoneyGeek and Zebra spreads show a 35%–80% gap baked into garaging geography on standard policies; the specialty route doesn’t shave that gap, it sidesteps the mechanism that creates it. Most coverage compares carriers within the standard pool and never crosses into the pool where the location math changes shape.
The $150k+ calculation
For a household at this income level, the location decision usually intersects with a multi-property reality. A primary residence in a dense metro and a second home in a lower-density area present a legitimate question about where a weekend exotic actually garages — and the answer carries a four-figure annual consequence on a single car, multiplied across a collection.
The threshold worth modeling is whether a vehicle qualifies as limited-use. A car driven under roughly 4,000 miles a year, stored securely, and not used for daily commuting is a candidate for specialty agreed-value coverage, where the urban garaging penalty compresses sharply. A daily-driven luxury car in the same ZIP stays in the standard pool and absorbs the full location surcharge. The line between those two outcomes is usage and storage, not income — but income is what makes the second car, the secure garage, and the limited-use profile feasible in the first place. Owners running the numbers across several vehicles will find the same per-car logic scales, and the broader picture sits alongside the luxury car insurance cost guide and the question of how rates shift across states. The decision isn’t whether to consult a specialist before restructuring a multi-vehicle policy — it’s whether the location penalty on your current setup is large enough that doing so pays for itself in the first year. On a single urban-garaged exotic, the data says it frequently is.
How much can garaging ZIP code alone change a luxury car premium?
For an identical driver and vehicle, ZIP code alone can change a premium by 30%–50%, according to 2026 rate-filing analysis from Covera. MoneyGeek’s 2025 study found metro-versus-rural gaps of 35%–80%. On a high-value car, that percentage sits on a much larger base, so the dollar consequence runs into the thousands annually.
Which states limit ZIP-based insurance pricing?
California, under Proposition 103 (1988), and Michigan, under its 2020 reform, both restrict ZIP code from being the primary rating factor. California requires driving record, annual mileage, and years of experience to carry the most weight. ZIP can still be a secondary factor in both states, so the location penalty is compressed rather than eliminated.
Does a specialty insurer ignore garaging location entirely?
No. Specialty collector insurers like Hagerty still weigh location, but the channel shifts from daily accident exposure toward theft risk and storage security. The traffic-density penalty that dominates standard pricing largely falls away for limited-use vehicles, which is why an urban-garaged exotic can price far lower on an agreed-value policy than on a daily-driver policy.
Can I use a lower-cost ZIP code to reduce my premium?
Only if the car genuinely garages there overnight. The garaging address must be where the vehicle is actually parked most of the time. Listing a different address to obtain a lower rate is material misrepresentation and can result in coverage rescission or claim denial. For owners with multiple legitimate residences, where a vehicle primarily sits is a real and defensible question.
Methodology
This analysis prioritized the primary and secondary sources listed in the Finluxy Auto Insurance cluster: the Insurance Information Institute (III) for industry context, and The Zebra, Insurify, and MoneyGeek for location-based premium benchmarks. I verified every location-spread figure and the two state-level rating restrictions against named sources published in 2025–2026 before writing, and flagged each as carrier- and state-specific rather than universal.
Premium decomposition follows the cluster’s total-cost-of-ownership framework, splitting the annual premium into liability, collision, comprehensive, uninsured/underinsured motorist, and umbrella rider components, with each component’s location sensitivity assessed against the underlying risk driver. Component shares are segment estimates synthesized from vehicle-class benchmarks, not figures for any single policy. The Finluxy Insurance Cost Ratio was calculated as annual premium divided by current market value times 100 for each garaging scenario. Where model- and ZIP-specific carrier quotes were unavailable, premium figures were modeled as segment estimates anchored to the verified urban/rural spreads and labeled as estimates throughout; no point figure was presented as a quote it was not.
Sources & References
- Best Money — The Zebra 2025 urban/rural premium spreads and garaging-address rules
- ValuePenguin — State of Auto Insurance 2025, national averages and parts-cost data
- MoneyGeek — Car insurance rates by state and ZIP, 2025–2026
- Covera — ZIP-code rate-filing analysis, 30%–50% identical-profile spread (2026)
- Consumer Watchdog — California Proposition 103 territorial-rating analysis
- InsuranceNewsNet — California (1988) and Michigan (2020) ZIP-rating restrictions
- Hagerty — Classic car insurance, agreed value and limited-use rating
- Car Talk — Hagerty review, storage and location treatment
- CarInsurance.com — How garaging ZIP sets the base rate