 Analysis by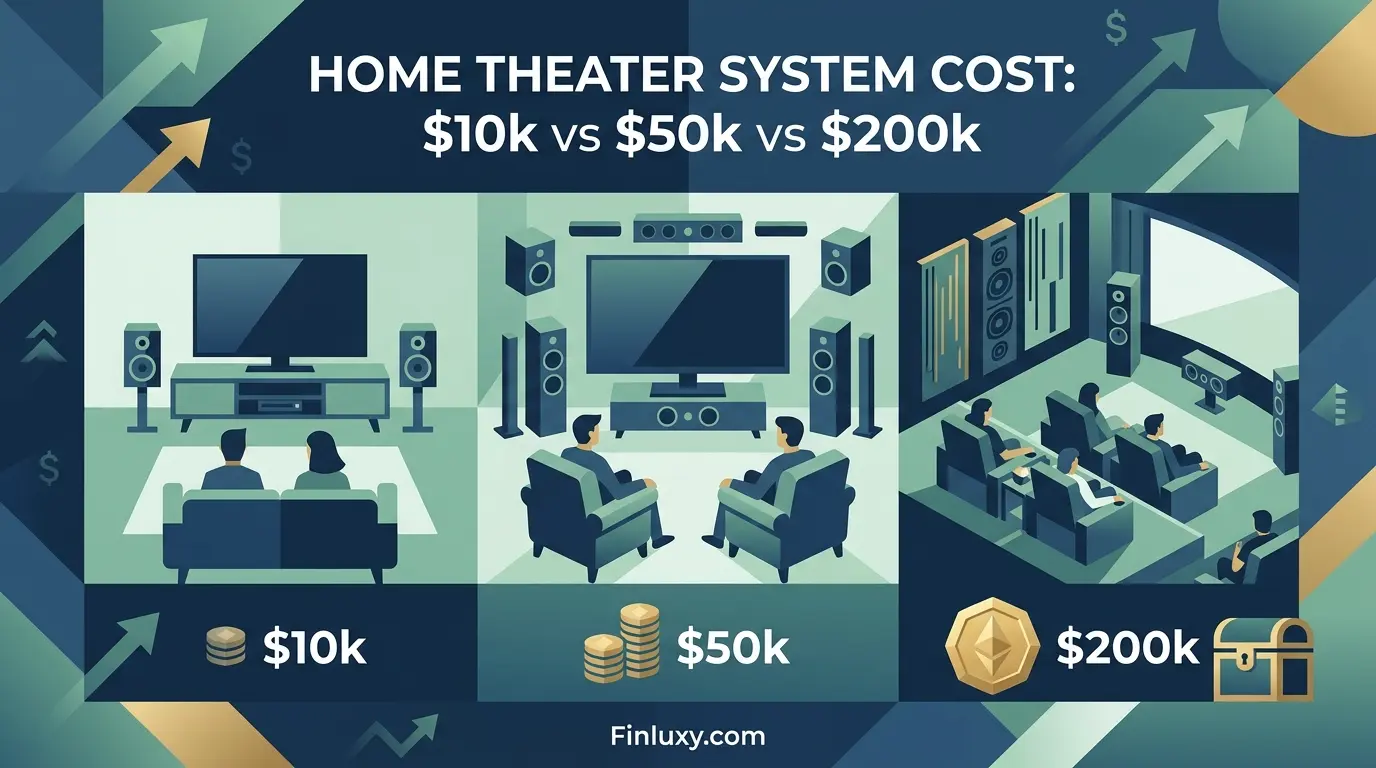
A flagship 4K laser projector that sold for $20,000 a decade ago is matched on picture quality by a $5,000 unit today, according to Audio Advice’s 2025 home theater cost analysis. That single fact reframes the entire premium home theater question. The gap between a $10,000 system and a $200,000 system is not a 20x difference in what reaches your eyes and ears — it is mostly a difference in construction, labor, residual value, and the diminishing returns of reference-grade hardware.
This analysis breaks the three price tiers into their component costs, then runs each through total cost of ownership and the Finluxy Tech Cost-Per-Day Rate. The goal is narrow: quantify what the marginal dollar buys as you climb from $10k to $50k to $200k, using independent testing and contractor pricing rather than manufacturer claims.
Scope: This article models three representative home theater builds — a $10,000 self-installed component system, a $50,000 professionally integrated mid-tier theater, and a $200,000 custom luxury build — using U.S. pricing current as of 2024–2026. Component and installation figures are drawn from contractor estimators (HomeAdvisor, Angi, Audio Advice, CEDIA-member integrators) and are presented as defensible ranges, not fixed quotes; actual pricing varies by room, region, and brand. Model-specific residual value data for individual AV components is not published systematically, so resale figures here are modeled from segment-level resale ratios and labeled accordingly. This is a cost analysis, not financial or purchasing advice.
The three tiers, by the numbers
Pricing for home theaters does not move in a smooth line. It clusters around three points: the DIY component build, the professionally integrated room, and the custom luxury install. HomeAdvisor’s 2025 data puts the typical installed home theater at roughly $20,000, with most projects landing between $10,000 and $60,000. Apex Theater Design’s 2026 pricing guide places budget builds in finished rooms at $8,000–$15,000, mid-range builds at $20,000–$50,000, and premium-to-luxury builds at $75,000–$250,000 and beyond.
| Figure | Value |
|---|---|
| Entry tier (DIY component system) | $10,000 |
| Mid tier (professional integration) | $50,000 |
| Luxury tier (custom build) | $200,000 |
| Typical installed home theater (median) | ~$20,000 |
| Modeled AV equipment resale ratio | 50%–80% |
Sources: HomeAdvisor (2025); Apex Theater Design 2026 Pricing Guide; Angi 2026 Data (resale/ROI ratio). Resale ratio applies to recoverable equipment value, not whole-project cost.
The 4.6% figure is worth holding onto as context. BLS Consumer Expenditure Survey 2024 data puts entertainment at 4.6% of total spending for the average consumer unit, and the highest income quintile averaged $150,342 in total annual expenditures that year. A $200,000 theater is not an entertainment line item for almost anyone — it is a capital project competing with kitchen renovations and vehicles.
What $10,000 actually buys
The entry tier is a component system you assemble and calibrate yourself, in a room you already have. No construction. No integrator. The money goes almost entirely to hardware, and the hardware at this level is genuinely capable.
Audio Advice’s 2024 budget guidance recommends allocating 40–50% of a sub-$10,000 build to the speaker package, because speakers outlast every other component and define the experience. A 5.1 or 5.1.2 Dolby Atmos array, a mid-tier AV receiver, a 4K projector in the $2,500–$5,000 band, and a quality 100-to-120-inch fixed-frame screen fit inside the envelope. The single best decision at this tier is what most coverage of the premium tech cost guide gets right: spend on the components that don’t depreciate fast, and stay off the bleeding edge of projector technology that resets every 18 months.
| Component | Typical range |
|---|---|
| 4K projector | $2,500–$5,000 |
| Fixed-frame / ALR screen (100–120″) | $1,000–$3,000 |
| 5.1–5.1.2 speaker package | $3,000–$4,500 |
| AV receiver | $700–$1,500 |
| Cabling, mounts, streamer, calibration | $500–$1,500 |
Sources: Audio Advice 2024–2025 home theater guides; AWOL Vision 2025 price breakdown; ProjectorScreen.com. Ranges reflect independent retailer and integrator pricing, not manufacturer MSRP claims.
The $50,000 jump: construction, not better pixels
Climbing from $10k to $50k does not five-times the picture. It buys a room. Apex Theater Design notes that most homeowners underestimate their budget by 30–40% because they account only for equipment and not for construction, acoustic treatment, and labor — which collectively often cost as much as the hardware itself.
At this tier the equipment improves incrementally: a 120-to-140-inch projection system, a 7.1 or full Dolby Atmos array, a higher-grade receiver or separates. The larger share goes to things you cannot see. Mid-range AV integration labor runs $3,000–$8,000 per Apex, electrical work $2,500–$6,000, and low-voltage wiring infrastructure $1,500–$5,000. Acoustic treatment, tiered seating, and a platform riser consume much of the rest. The performance delta over the $10k build is real but modest; the experiential delta — a dark, quiet, acoustically correct dedicated room — is large. This is the same dynamic that governs the smart home ecosystem cost question: integration and infrastructure, not the marquee device, drive the bill.
Independent testing supports the skepticism about hardware at the top. RTINGS and DisplayMate measurements consistently show the perceptual gap between a strong mid-tier projector and a reference unit is far narrower than the price gap. You pay linearly for picture quality that improves logarithmically.
$200,000: the residual value problem
The luxury tier is where the economics turn against the buyer hardest. Longwire’s 2025 pricing puts a high-end build around $125,000 — a 133-inch-plus screen, premium 4K laser projector, theater-grade Dolby Atmos, eight luxury seats, lighting control. Push to $200,000 and you add custom construction, reference acoustic design, and CEDIA-certified project management, which Apex prices at an additional $10,000–$25,000 on premium builds.
Here is the part the brochures omit. AV electronics depreciate fast and unevenly. Angi’s 2026 data pegs home theater ROI — the share of project cost recoverable through resale value — at 50% to 80%, and that figure blends recoverable construction value with rapidly depreciating electronics. Projectors are the worst offenders: a unit launched at $12,000 MSRP can trade for $6,500 or less within a month on the secondary market, per long-running enthusiast tracking on AVS Forum. The screen, the wiring, and the room hold value. The flagship projector does not.
Model-specific resale data for individual components is not published systematically, so the residual figures below are modeled from the 50–80% equipment resale ratio applied to recoverable hardware, with construction value treated separately. They illustrate the cost structure rather than quote a market price for any one unit.
Finluxy Tech Cost-Per-Day Rate
The Finluxy Tech Cost-Per-Day Rate isolates what ownership costs per day after residual value, across the ownership period. Rate = (purchase price − residual value) ÷ days owned. For a home theater the relevant ownership window is the AV refresh cycle, not the room’s lifespan — HomeAdvisor and Angi both advise reviewing electronics every four to five years even though the room itself lasts as long as the house.
The model below applies a 65% residual ratio (the midpoint of Angi’s 50–80% range) to recoverable equipment value, holding construction and labor as sunk cost since they are not resold. Two ownership windows are shown: a 5-year cycle (1,825 days) and an 8-year cycle (2,920 days). Longer ownership spreads the net cost across more days and drops the rate — the same cycle-length effect that governs the laptop upgrade cycle cost math.
| Tier | Purchase price | Modeled residual value | Net cost | Rate — 5-year cycle | Rate — 8-year cycle |
|---|---|---|---|---|---|
| Entry ($10k, all equipment) | $10,000 | $6,500 | $3,500 | $1.92/day | $1.20/day |
| Mid ($50k, ~$25k equipment) | $50,000 | $16,250 | $33,750 | $18.49/day | $11.56/day |
| Luxury ($200k, ~$70k equipment) | $200,000 | $45,500 | $154,500 | $84.66/day | $52.91/day |
Source: Author calculation. Residual value modeled at 65% of recoverable equipment value (Angi 2026, 50–80% range midpoint); construction and labor treated as non-recoverable sunk cost. Equipment shares estimated from Apex Theater Design and Longwire tier breakdowns. Model-specific residual data unavailable at publication.
The rate exposes the real curve. The entry system costs roughly $1.20–$1.92 a day. The mid-tier theater costs about ten times that. The luxury build costs forty-plus times the entry rate — and most of that net cost is construction and labor that no resale market recovers. The hardware that drives the picture and sound is a minority of the spend at $200k, and it is the part that depreciates fastest.
What the data shows that most coverage misses
Nearly every home theater cost guide frames the decision as a quality ladder: more money, better experience. The cost-per-day data shows something different. The experiential return is concentrated almost entirely in the jump from no dedicated room to a treated, dark, acoustically correct one — a transition that completes around the $50k tier. Past that point, additional spending buys residual-value risk far faster than it buys perceptible performance, because the electronics that command the premium are exactly the components that depreciate hardest and get replaced every four to five years. The $200,000 buyer is not buying 4x the theater of the $50,000 buyer. They are buying roughly the same theater experience wrapped in finishes and reference hardware that the resale market discounts steeply. This mirrors the pattern in the 4K TV cost per hour analysis: the perceptual ceiling arrives well before the price ceiling does.
Context for the $150k+ household
For a household in the top income quintile — BLS pegs that quintile’s 2024 lower bound at $155,925 in income — none of these builds is financially reckless in isolation. The relevant question is not affordability but allocation. A $10,000 system delivers the majority of the achievable experience at a cost-per-day comparable to a daily coffee. The $50,000 tier is the defensible ceiling for most: it captures the dedicated-room transition where experiential return is highest, and its net-cost-per-day, while ten times the entry build, still reflects genuine infrastructure that partially survives resale.
The $200,000 build is a discretionary luxury decision, not a value decision, and it should be evaluated as one. At an effective net cost north of $50 a day even on a patient 8-year cycle, with the marquee electronics depreciating fastest and ROI on the whole project capped at 50–80% per Angi, the marginal $150,000 over a strong mid-tier theater buys finishes, prestige, and reference specs that independent testing struggles to distinguish perceptually. The same scrutiny applied to a 3-year iPhone cost cycle or to device trade-in upgrade math applies here, only with two more zeros: the smart money tracks residual value and cost-per-day, plans the AV refresh cycle around a 5-to-8-year window like any other annual tech spend benchmark, and treats the room — not the projector — as the durable asset.
Is a $50,000 home theater meaningfully better than a $10,000 one?
Yes, but mostly because of the room, not the hardware. The $10k tier delivers strong components in an existing space; the $50k tier adds a dedicated, acoustically treated, light-controlled room. Apex Theater Design notes construction, acoustics, and labor often cost as much as the equipment itself. The picture-and-sound hardware improves only incrementally between the two tiers.
Why does the luxury tier have such a high cost-per-day?
Because most of a $200,000 build is construction, labor, and finishes that the resale market does not recover, and the electronics that do drive performance depreciate fastest. Angi’s 2026 data caps home theater ROI at 50–80% of project cost, and high-end projectors can lose half their value within months of release per secondary-market tracking.
How long should home theater electronics last before replacement?
HomeAdvisor and Angi both recommend reviewing AV electronics every four to five years for format and performance changes, while speakers and the room itself can last a decade or longer. The Finluxy model above uses 5-year and 8-year ownership windows to show how a longer cycle lowers the cost-per-day rate.
Does a home theater add resale value to a house?
Partially. Angi’s 2026 data estimates 50–80% ROI depending on quality and integration. The room, wiring, and screen retain value better than the electronics. A well-finished dedicated theater can add buyer appeal in luxury markets, but it appeals to a narrower buyer pool than a kitchen or bathroom renovation.
Methodology
Component and installation figures were prioritized from contractor cost estimators and CEDIA-affiliated integrators (HomeAdvisor 2025, Angi 2026, Apex Theater Design 2026, Longwire 2025, Audio Advice 2024–2025) and presented as ranges rather than point quotes, because home theater pricing varies materially by room, region, and brand. Performance claims rely on independent testing references (RTINGS, DisplayMate) rather than manufacturer specifications, consistent with the cluster’s sourcing rules. Household income and spending context comes from the BLS Consumer Expenditure Survey 2024 release. The Finluxy Tech Cost-Per-Day Rate was calculated as (purchase price − residual value) ÷ days owned, applying a 65% equipment resale ratio (midpoint of Angi’s 50–80% range) to recoverable hardware while treating construction and labor as non-recoverable sunk cost. Because model-specific residual values for individual AV components are not published systematically, residual figures are modeled at the segment level and labeled as such; readers can refine them using current secondary-market listings on Swappa or comparable platforms.
Sources & References
- BLS Consumer Expenditure Surveys 2024 — household income quintile and entertainment spending data
- HomeAdvisor — 2025 home theater installation cost data
- Angi — 2026 home theater installation cost and ROI data
- Apex Theater Design — 2026 home theater renovation pricing guide
- Audio Advice — home theater budget allocation guidance
- Longwire — high-end home theater design and installation pricing
- ProjectorScreen.com — projector and screen pricing reference
- AVS Forum — projector secondary-market depreciation discussion