Skip to content
Finluxy
Finluxy
  • Affluent Living
  • Income Reality
  • Life & Money
  • Luxury Spending
  • Real Estate
  • Smart Spending
  • Tax & Wealth

Premium Tech

Technology spending has become one of the fastest-growing discretionary categories for high-income households — and one of the most susceptible to spec escalation that delivers diminishing marginal returns at increasing cost. Understanding where premium tech spending creates genuine value and where it’s primarily serving the psychological appeal of owning the best version of something is a useful financial discipline in a category where the pace of product releases creates constant upgrade pressure.

Computing and mobile are the foundation. Apple’s MacBook Pro lineup ranges from $1,999 to $7,000+ for fully configured M-series machines — the performance difference between the entry-level and top configuration is meaningful for specific professional workflows (video editing, 3D rendering, large model training) and nearly imperceptible for general knowledge work. The iPhone Pro Max at $1,199–$1,599 versus the standard iPhone at $799–$899 delivers camera upgrades that matter for serious mobile photography and are largely invisible for everyday use. Knowing your actual use case before selecting a tier is worth more than any benchmark comparison.

Home theater and audio at the premium level involves costs that can scale dramatically. A quality living room setup — 75″ OLED display, surround sound receiver, and bookshelf speakers — can be assembled for $5,000–$8,000. A dedicated home theater room with a 4K projector, acoustically treated space, and premium speaker system runs $30,000–$150,000. Smart home infrastructure — Control4, Crestron, or Savant systems for integrated lighting, audio, climate, and security — typically runs $20,000–$100,000 for a full installation with a professional integrator.

For evaluating any specific premium tech purchase, the cost per use framework and the luxury vs. premium distinction provide the most useful analytical starting points. The Smart Spending pillar covers premium tech alongside the other major discretionary spending categories where intentionality consistently improves outcomes.
Geometric vector illustration of premium technology devices like a laptop and phone alongside subtle financial growth symbols.

Premium Tech Cost Guide for $150k+ Households

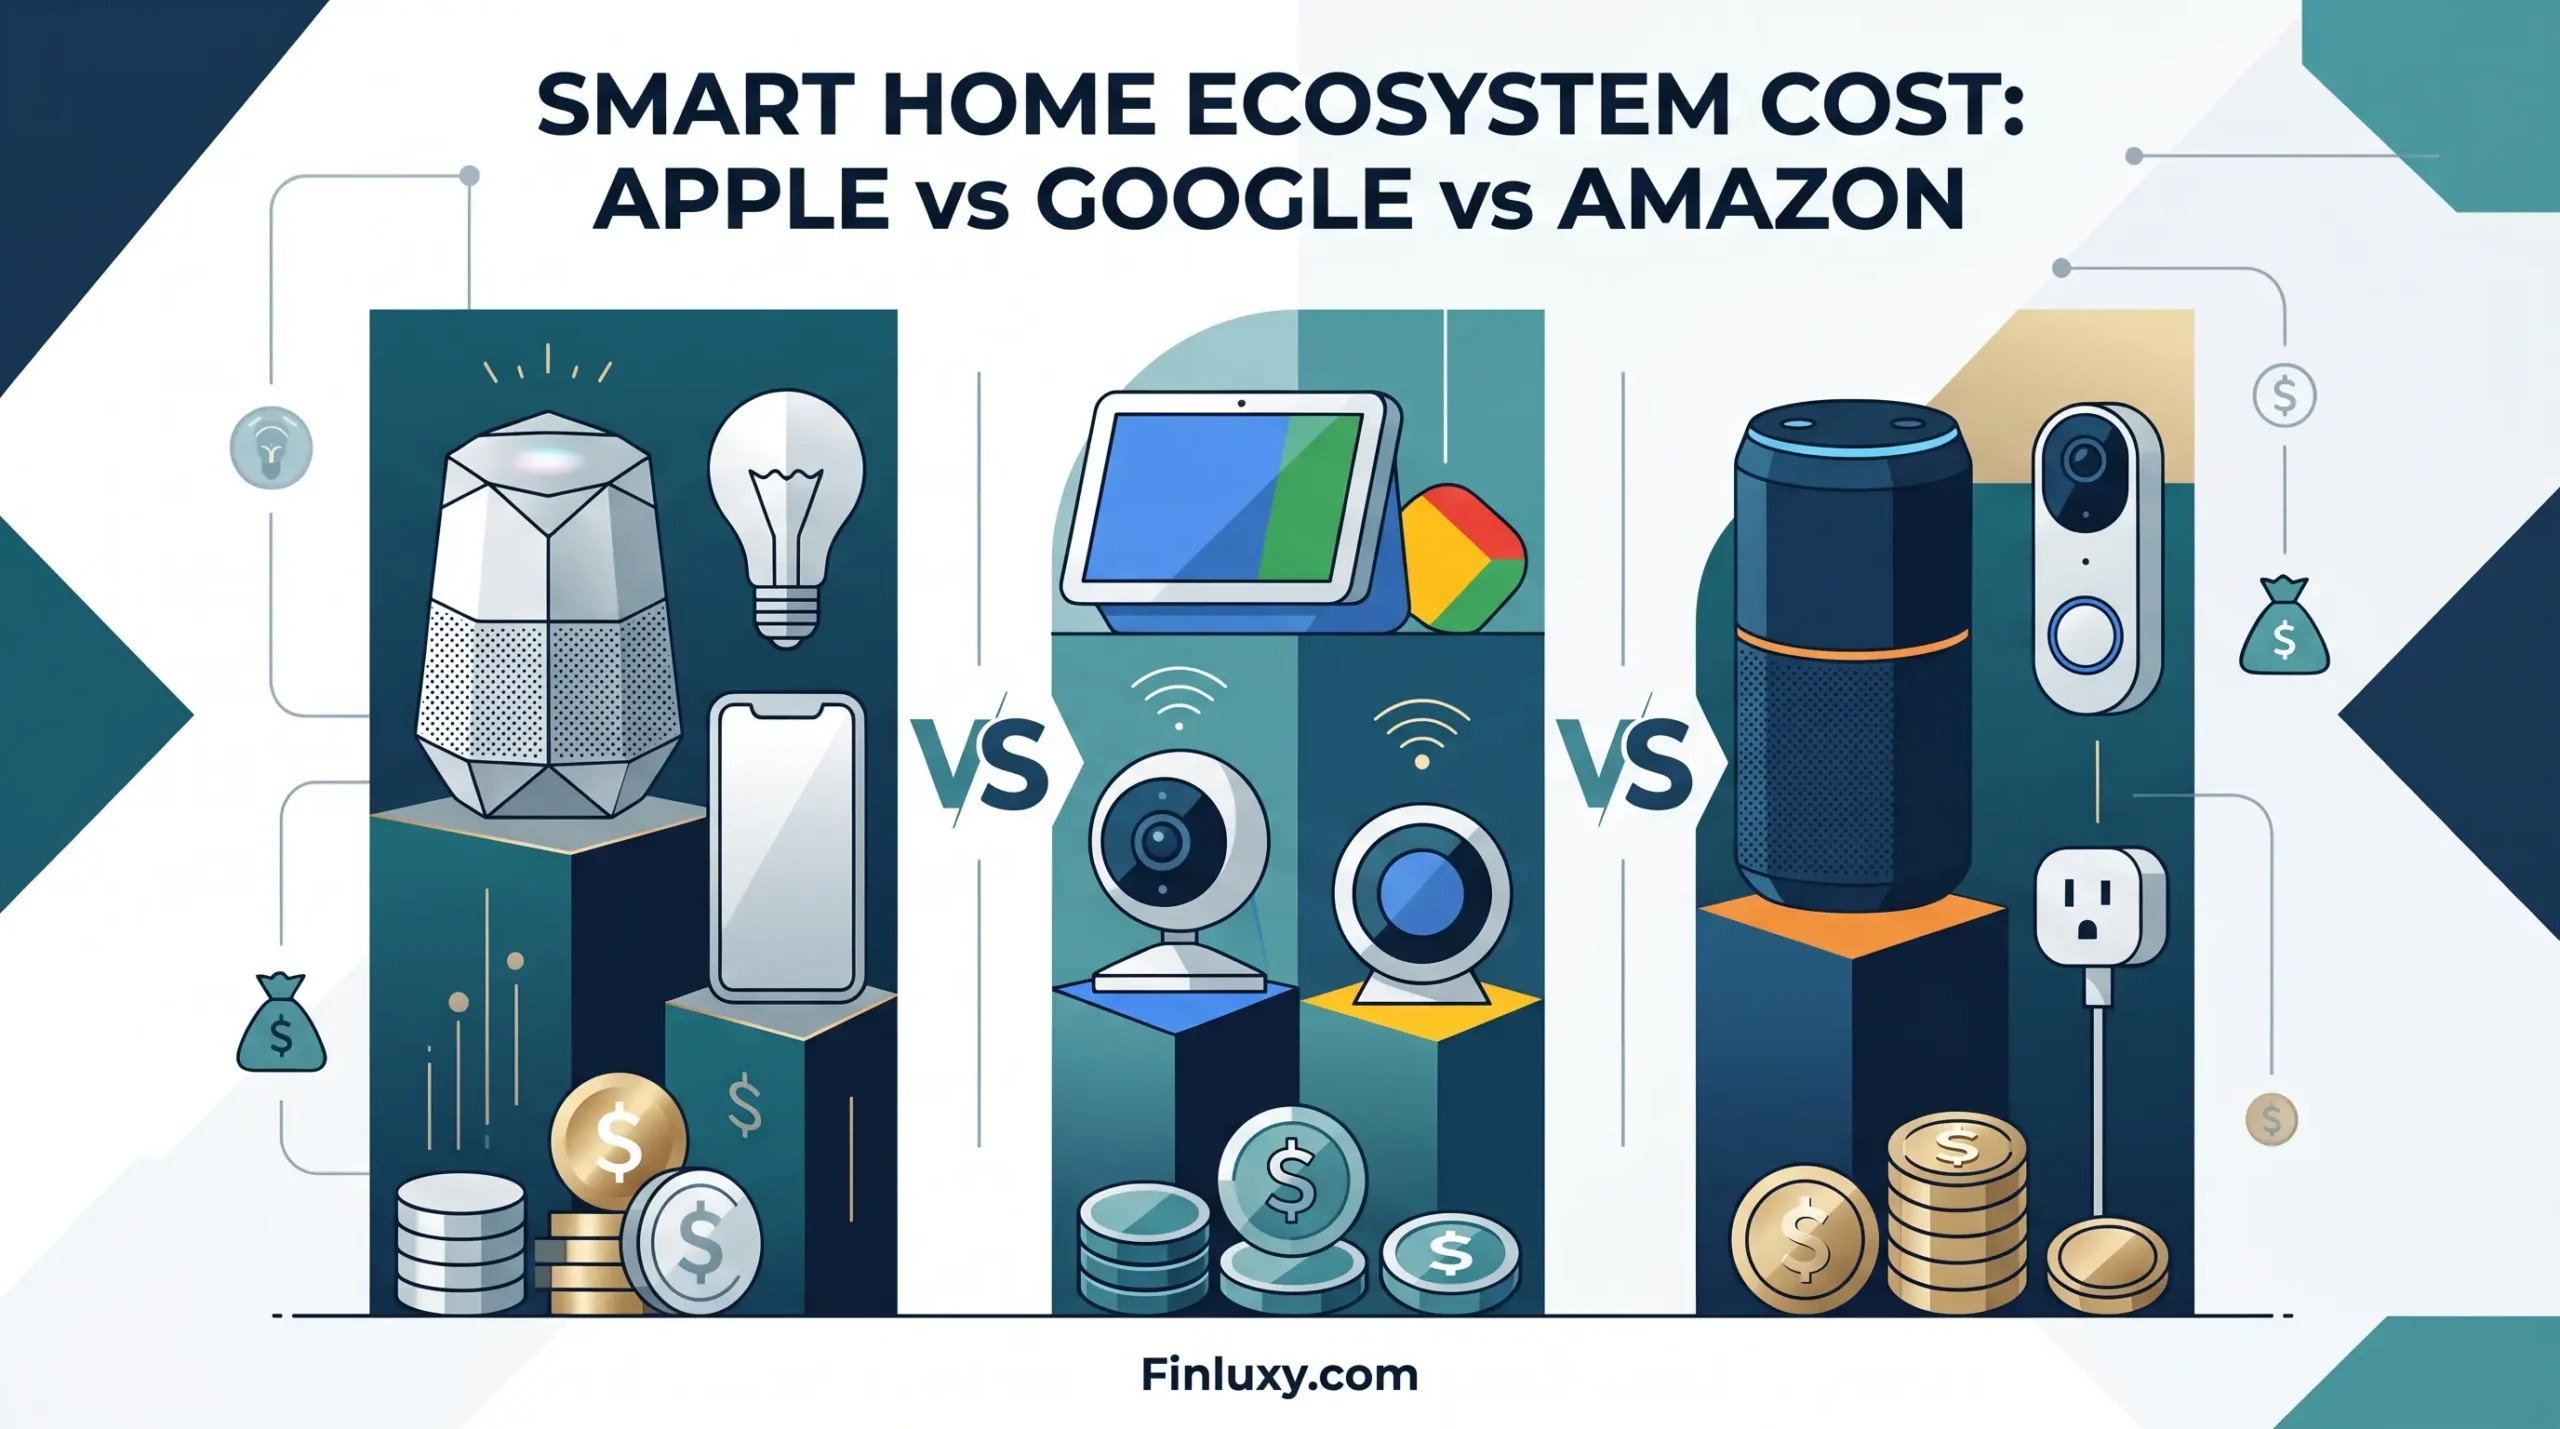
Geometric vector illustration comparing smart home devices from Apple, Google, and Amazon with subtle coin elements and a "Finluxy.com" watermark.

Smart Home Ecosystem Cost: Apple vs Google vs Amazon

Geometric vector illustration comparing an Apple Watch and a Garmin watch on scales, with coins representing annual cost comparison.

Apple Watch vs Garmin: Annual Cost Compared

Geometric vector illustration of smartphones on a balance scale with money, a thinking man, and the headline "How Device Trade-In Value Affects Upgrade Math."

How Device Trade-In Value Affects Upgrade Math

Geometric vector illustration of a modern house surrounded by smart devices and finance elements, featuring tech spending headline.

Annual Tech Spend for $150k+ Households: Data

Geometric vector illustration for Finluxy.com article, "Premium Noise-Canceling Headphones: 3-Year Math," showing headphones, financial icons, and a timeline.

Premium Noise-Canceling Headphones: 3-Year Math

Geometric vector graphic comparing OLED and LCD television screens with finance elements, featuring headline "4K TV Cost Per Hour Watched: OLED vs LCD."

4K TV Cost Per Hour Watched: OLED vs LCD

Geometric vector illustration of a laptop showing "2 vs 3 vs 4 Years Math" with minimal finance elements and Finluxy.com.

Laptop Upgrade Cycle: 2 vs 3 vs 4 Years Math

A geometric vector illustration comparing yearly iPhone costs with abstract shapes, coins, and 'Finluxy.com' footer text.

iPhone 16 Pro Max: True Cost Over 3-Year Cycle

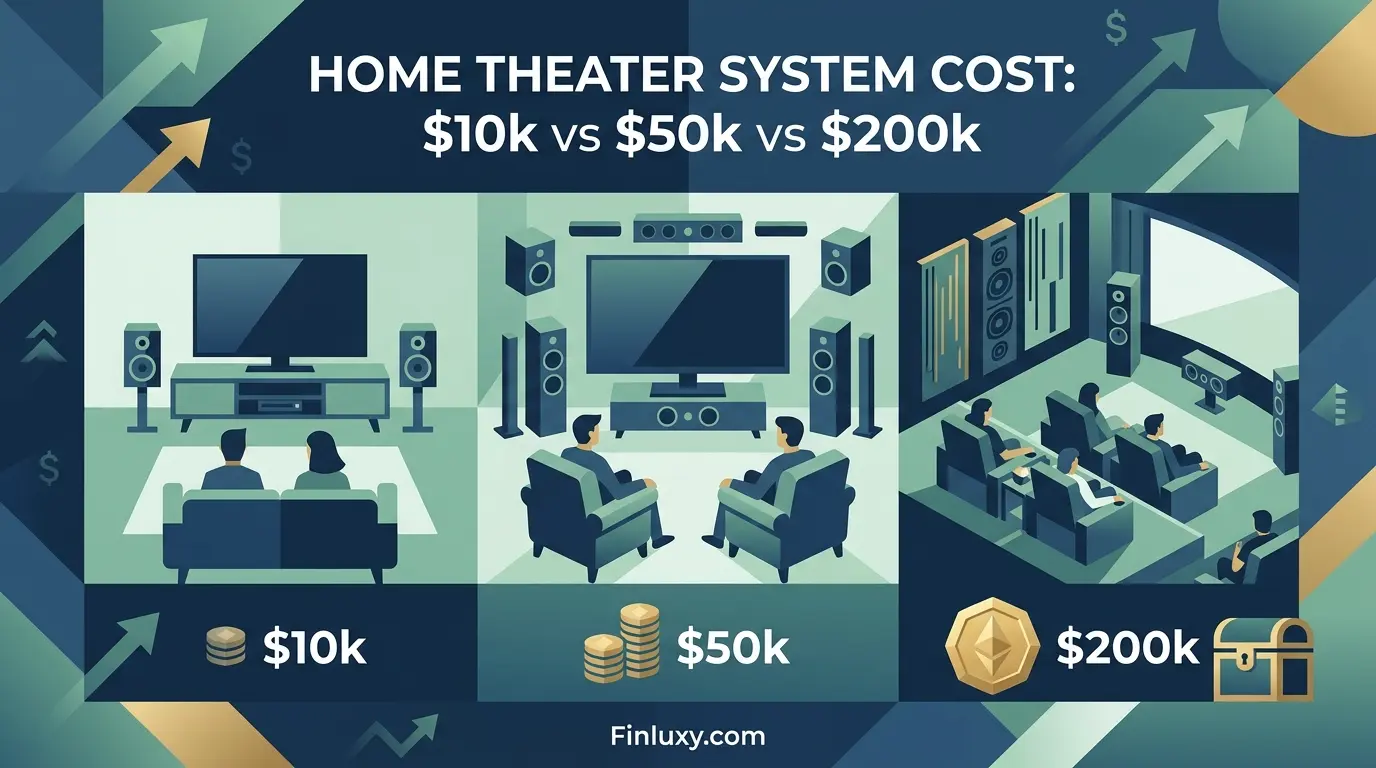
A modern geometric illustration comparing home theater systems at different price points: $10k, $50k, and $200k, on Finluxy.com.

Home Theater System Cost: $10k vs $50k vs $200k

A modern vector illustration comparing the financial cost of upgrading iPhones and Android smartphones.

Apple vs Android Upgrade Cycle: Which Costs More?

Vector illustration comparing a MacBook Pro and a Windows laptop with money bags and growth graphs, titled "MacBook Pro vs Windows Laptop: 4-Year Cost Math" for Finluxy.com.

MacBook Pro vs Windows Laptop: 4-Year Cost Math

  • About
  • Privacy Policy
  • Editorial Policy
  • Disclaimer
  • Affiliate Disclosure
  • Terms of Use
  • Contact
© 2026 Finluxy. All Rights Reserved.