Skip to content
Finluxy
Finluxy
  • Affluent Living
  • Income Reality
  • Life & Money
  • Luxury Spending
  • Real Estate
  • Smart Spending
  • Tax & Wealth

Career Change

Career change decisions are among the most financially consequential a person makes, and they’re consistently evaluated with less rigor than smaller financial decisions. The headline comparison — “I’d make $40,000 more” — captures only one variable of a multi-variable problem. A complete financial evaluation of a career change accounts for trajectory (where does the new path lead over 5–10 years?), total compensation (base plus bonus plus equity plus benefits), sunk costs versus opportunity costs (what’s left behind versus what’s gained?), and the non-financial factors that determine whether the change is actually sustainable.

The opportunity cost of leaving equity is one of the most commonly underweighted variables. An employee with three years of unvested RSUs may be leaving $200,000–$500,000 of unvested equity on the table for a new offer. New employers often provide an equity “catch-up” grant to compensate — but the vesting schedule, valuation, and liquidity of the new equity may differ significantly from what’s being left. Negotiating to accelerate vesting at the departing company or timing the departure around vest dates can recover a significant portion of this cost.

Career change to a higher-ceiling field — moving from consulting to private equity, from corporate law to a law firm with major client origination opportunities, from a mid-size tech company to a FAANG-equivalent — involves an income trajectory comparison that’s more important than the year-one delta. If the new path puts you on a track to earn $500,000 in five years versus $300,000 on the current track, the year-one comparison is almost irrelevant. Building a 10-year income projection model for both paths, discounted for risk, is the most rigorous approach.

For profession-specific compensation trajectories to inform this analysis, see profession pay. For the compounding impact of salary differences over time, see raise math. The Income Reality pillar covers career change within the full framework of income optimization over a career.
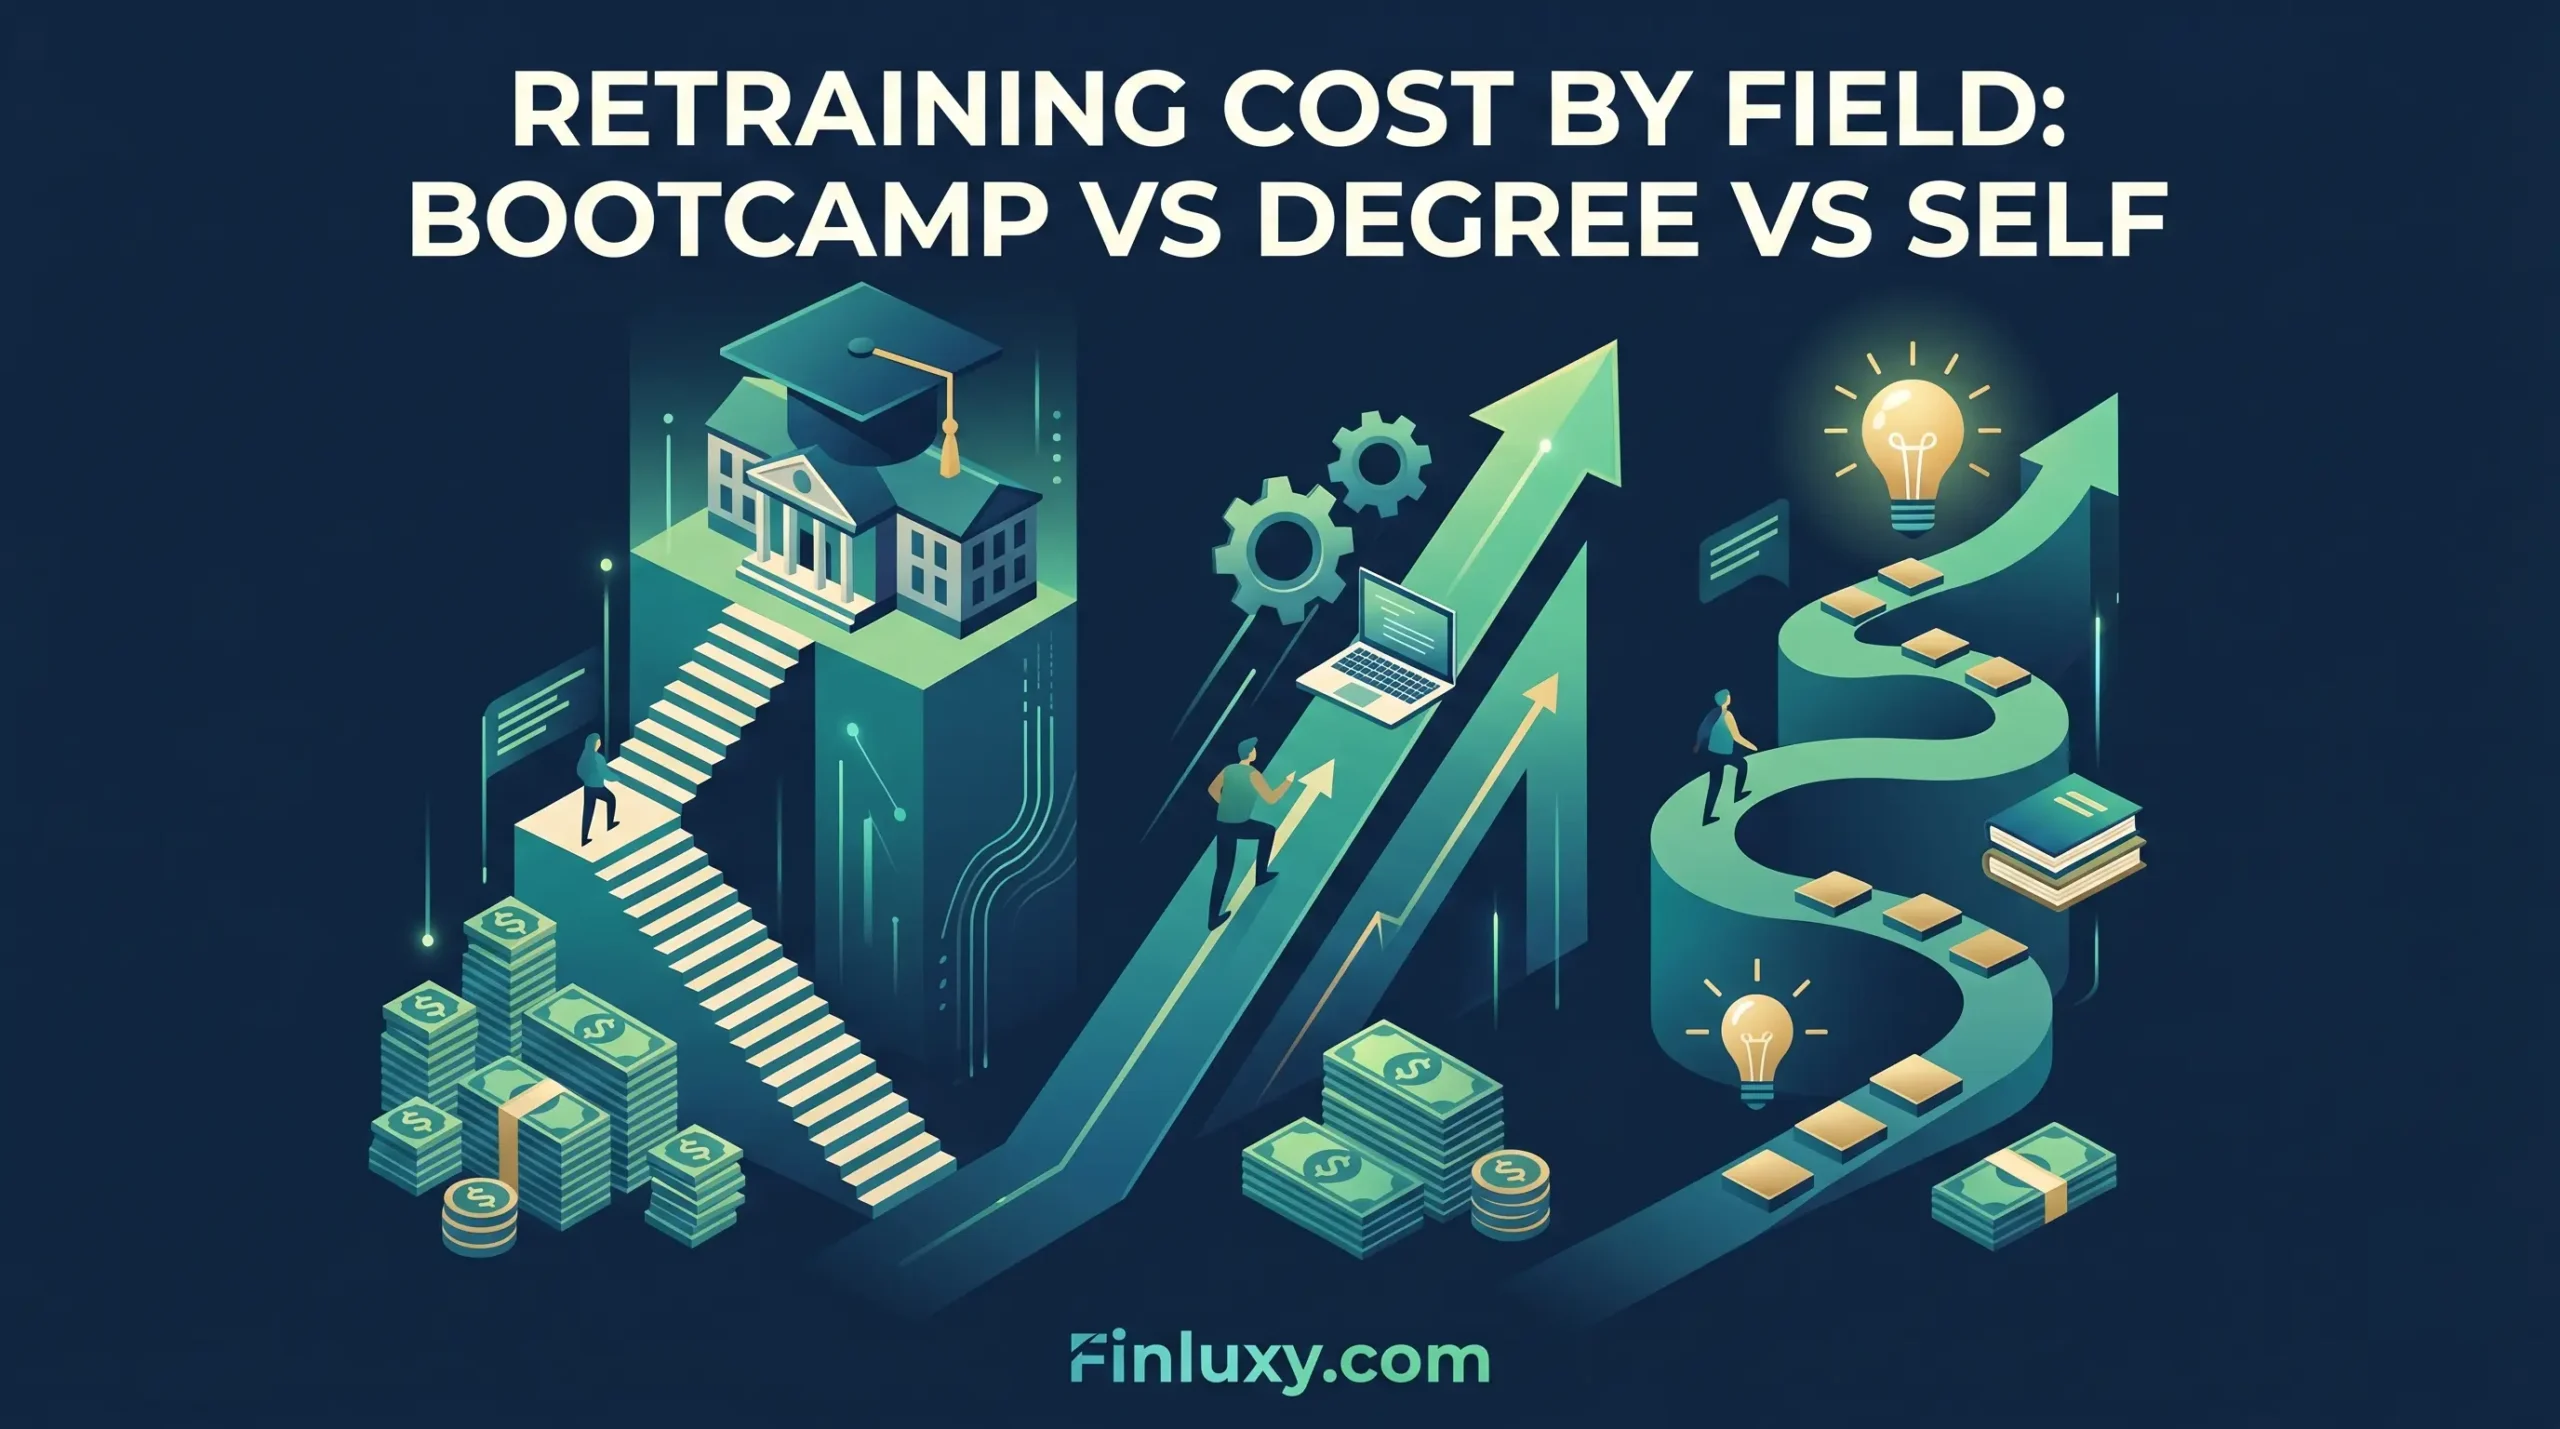

An isometric vector illustration with the headline: "RETRAINING COST BY FIELD: BOOTCAMP VS DEGREE VS SELF" and "Finluxy.com" at the bottom. The image shows three pathways to career success: one for university, one for bootcamps, and one for self-learning. It features cash stacks, an university building, a laptop with arrows and gears, and lightbulbs. The design is in a professional dark-blue and green gradient style.

Retraining Cost by Field: Bootcamp vs Degree vs Self

Geometric illustration of a professional navigating abstract pathways toward a glowing doorway, surrounded by subtle financial symbols.

Career Change Financial Guide for $150k+ Earners

Geometric illustration comparing a steady career path with a dynamic, upward-leaping one, representing income growth.

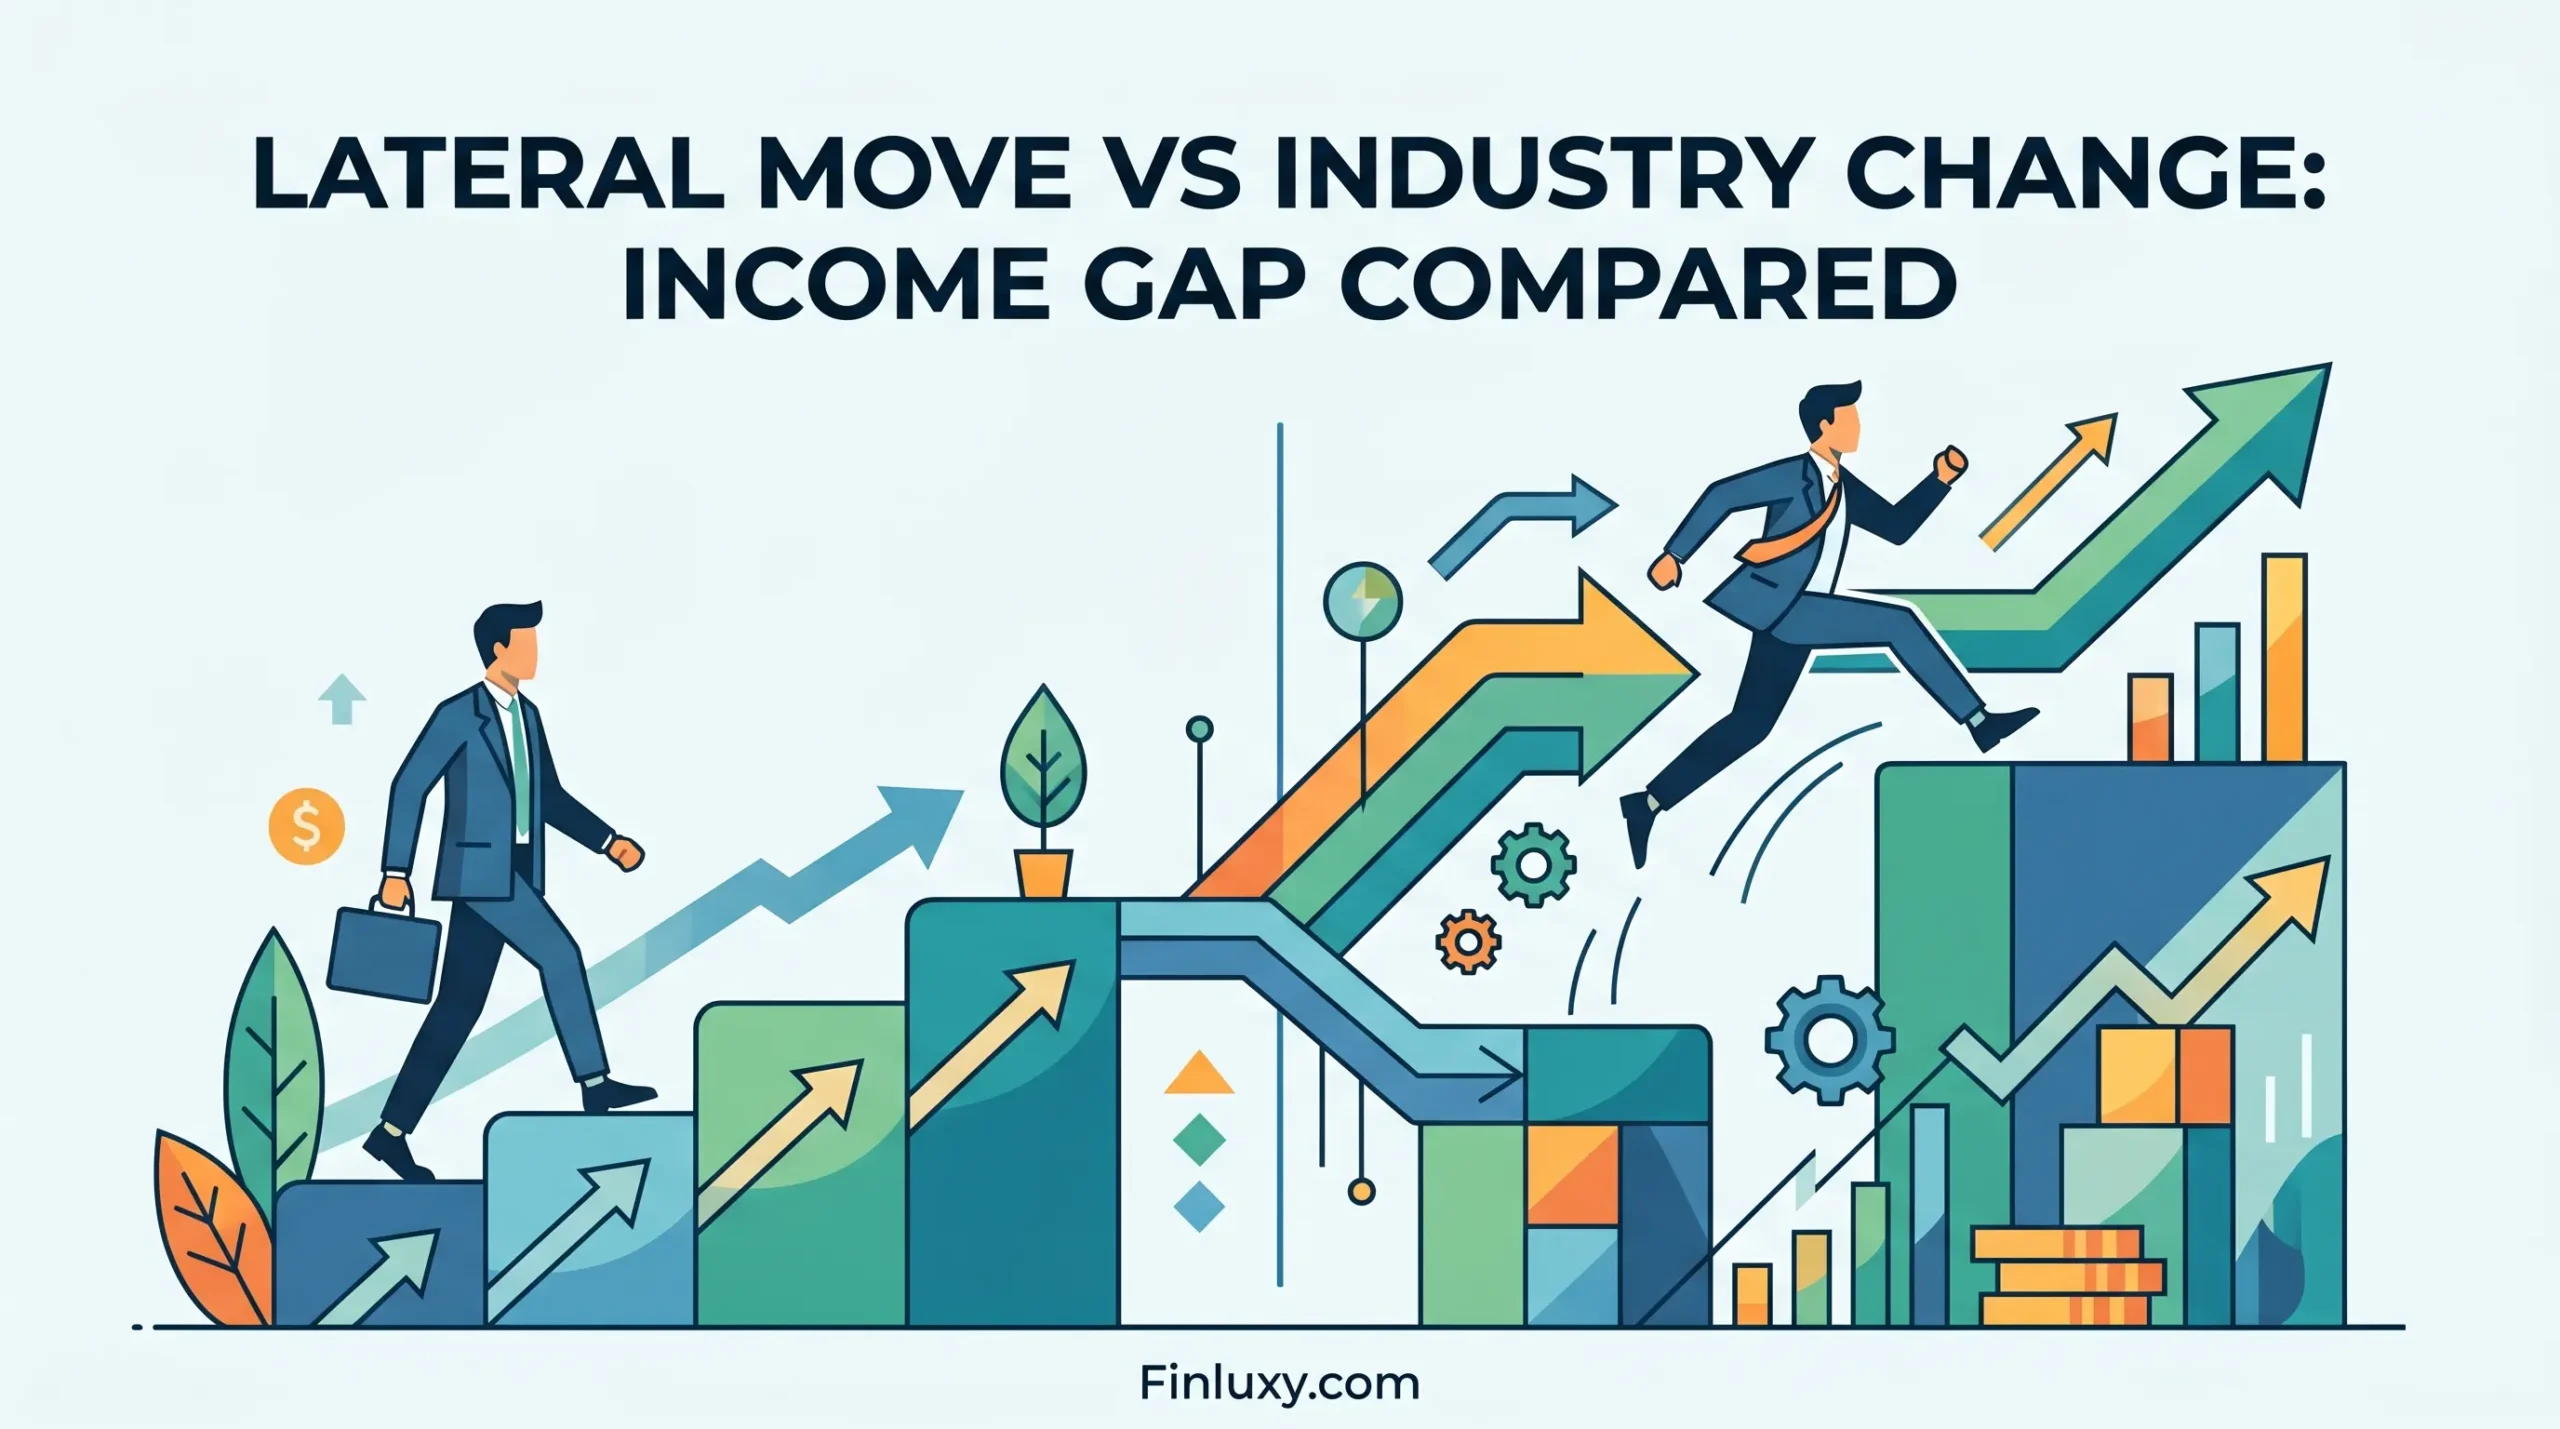
Lateral Move vs Industry Change: Income Gap Compared

An illustration showing a man leaving a high ledge for a deep canyon, representing a career transition and financial valley.

Attorney to Tech: Income Valley and Break-Even Math

Geometric vector illustration of a man in a suit facing a luminous doorway, with a medical symbol and abstract coins, representing a career transition.

Doctor Leaving Medicine: Financial Transition Cost

A geometric vector illustration shows a professional walking from a stack of money and a graduation cap towards growing coin piles and a career-unlocking key.

Cost of an MBA to Change Careers: Full ROI Math

A stylized vector illustration showing a scale balancing a large stack of cash and coins against a rocket ship and arrow symbolizing startup growth.

Finance to Startup: Salary Cut and Equity Trade-Off

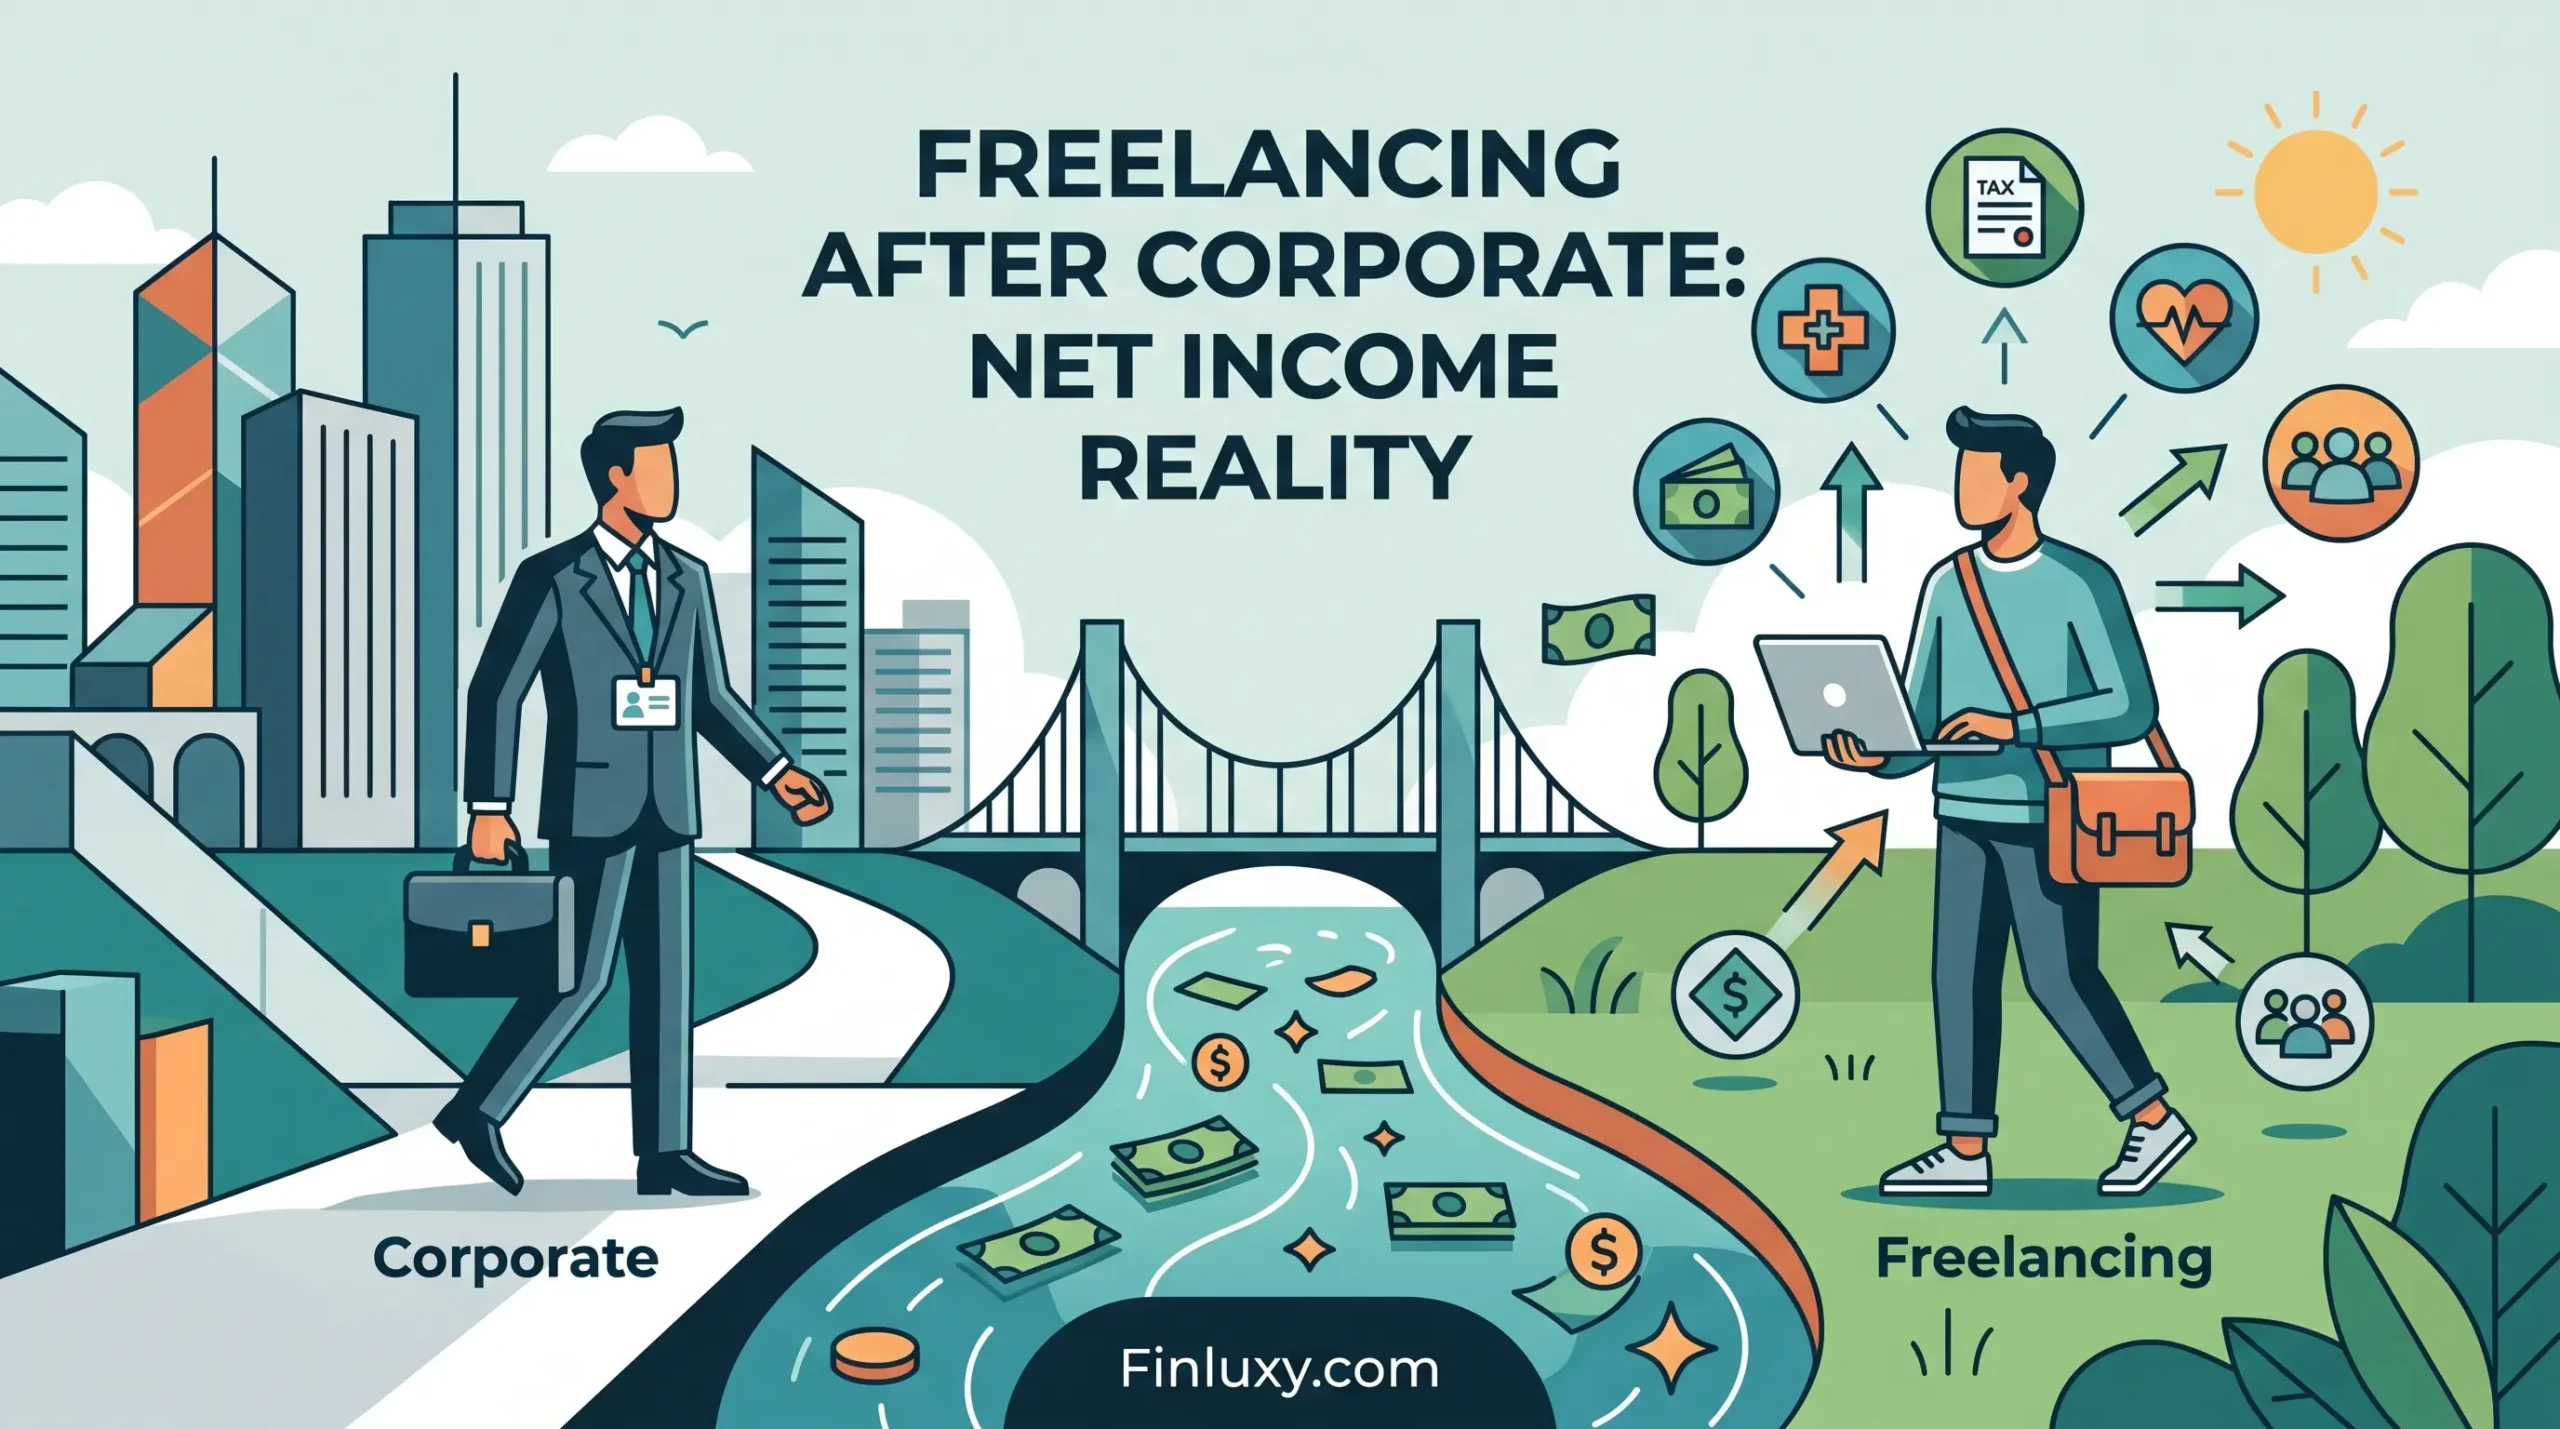
Geometric illustration comparing a corporate employee in a city to a freelancer with expenses like taxes and healthcare.

Freelancing After Corporate: Net Income Reality

Geometric illustration showing a faceless figure navigating a dipped path that rises upward, symbolizing an income valley.

How Long Does a Career Change Income Valley Last?

Geometric illustration showing a balance scale, coins, and directional arrows representing the financial transition from consulting to corporate.

Consulting → Corporate: What the Income Trade Looks Like

Modern vector illustration of a person stepping across a geometric bridge balancing scales, representing a career change, financial risk, and finding break-even.

Career Change at 40: Financial Risk and Break-Even

  • About
  • Privacy Policy
  • Editorial Policy
  • Disclaimer
  • Affiliate Disclosure
  • Terms of Use
  • Contact
© 2026 Finluxy. All Rights Reserved.