Skip to content
Finluxy
Finluxy
  • Affluent Living
  • Income Reality
  • Life & Money
  • Luxury Spending
  • Real Estate
  • Smart Spending
  • Tax & Wealth

Raise Math

A salary negotiation is not a one-time event — it’s a permanent reset of the base from which all future compensation compounds. A $15,000 raise at 30 years old, held constant in percentage terms for 20 years at a 3% annual increase, produces approximately $270,000 in cumulative additional income by age 50, plus corresponding increases in bonus (typically calculated as a percentage of base), 401(k) employer match (often a percentage of base), and equity grants that are frequently sized as multiples of salary. The raise math argument for negotiating aggressively early in a career is mathematically compelling in a way that most employees don’t fully internalize.

The mechanics of a successful raise negotiation start with the market data from salary check. Entering a compensation conversation with specific market data — “Levels.fyi shows total compensation for my role and level at comparable companies averaging $X” — is categorically more effective than a conversation grounded in personal financial need. Employers set compensation against market benchmarks; aligning your argument to that framework signals market awareness and reduces the interpersonal friction of the negotiation.

Timing matters significantly. Annual reviews are the obvious moment, but they’re also the moment when budget decisions have often already been made. Negotiating at the point of a job offer — before accepting — is statistically the most effective moment, as employers are least resistant to adjustment before the hire is finalized. Negotiating after a significant achievement, promotion, or scope expansion is the other high-leverage window. Asking during a performance cycle with no triggering event is the least effective approach.

For earners considering a job change as the fastest path to a significant income increase, the analysis in career change provides the financial framework for evaluating the move. The Income Reality pillar covers raise math alongside all the other strategies for growing income over a career.
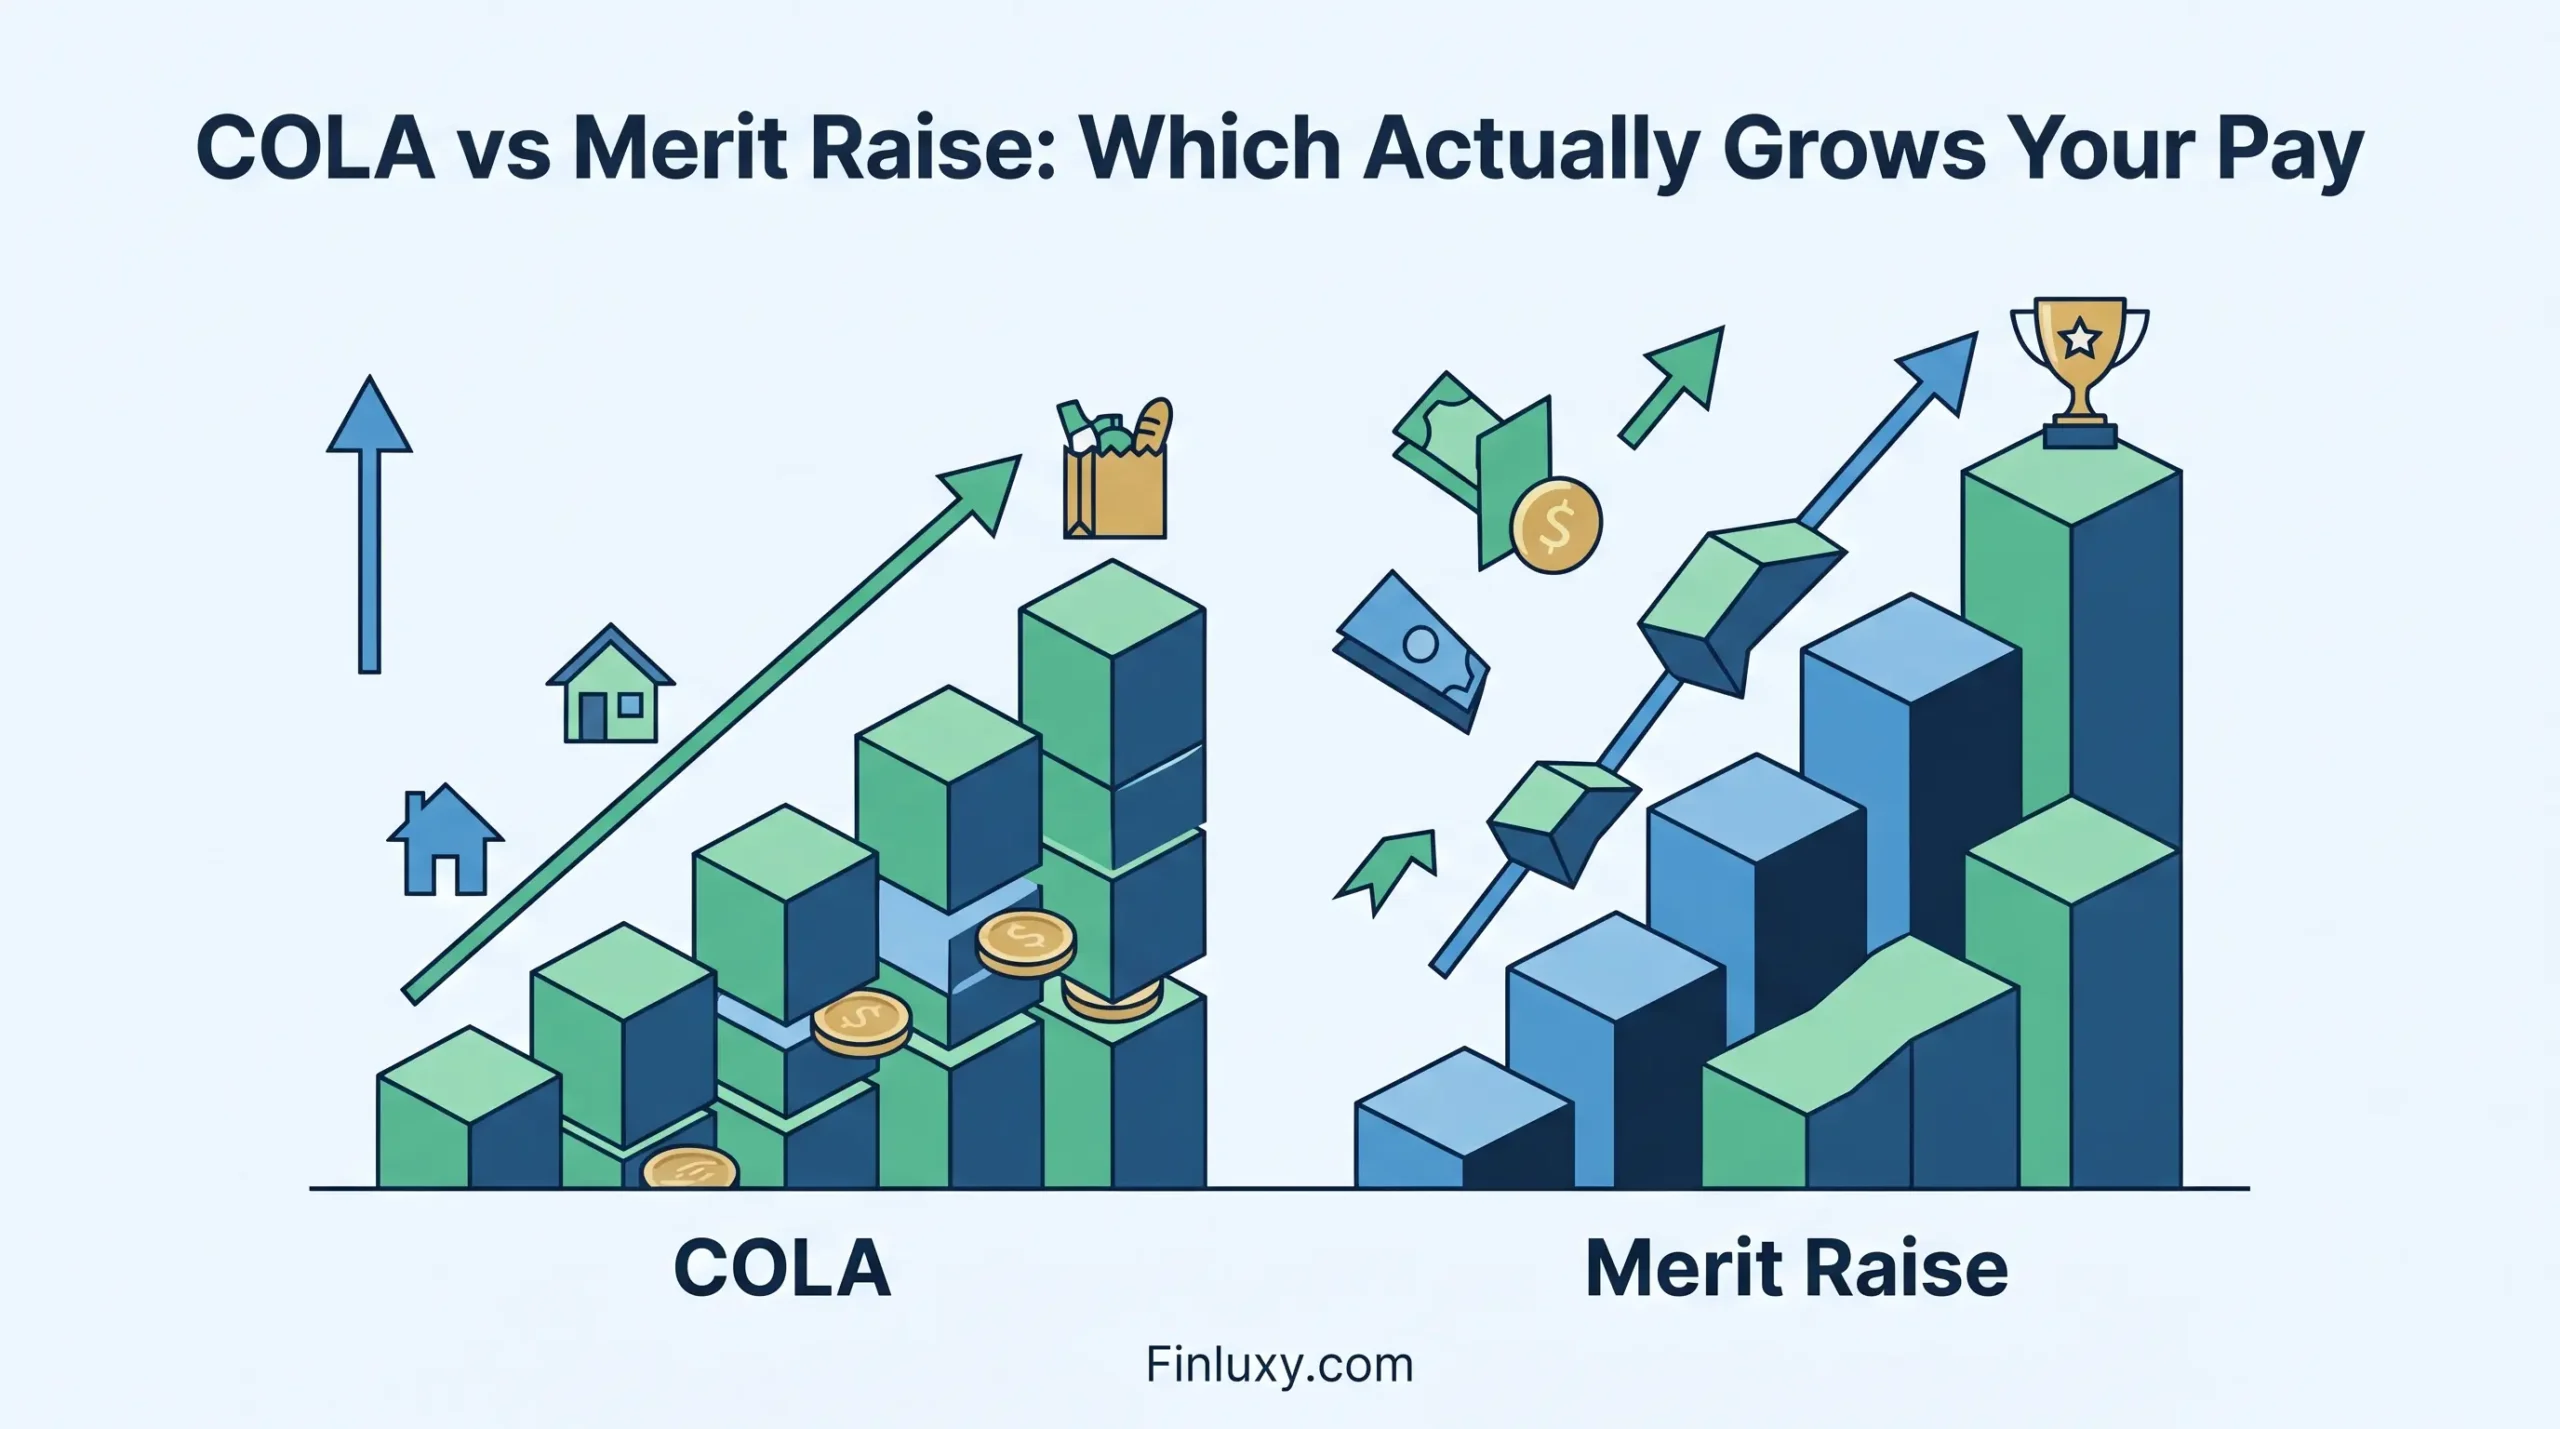

A geometric vector illustration comparing steady COLA growth with steeper, trophy-winning merit raise pay increases, for Finluxy.com.

COLA vs Merit Raise: Which Actually Grows Your Pay

A modern geometric illustration displaying an upward growth trend and a clock highlighting Q1 timing impact.

Raise Timing Impact: Why Getting It in Q1 Matters

Geometric vector illustration contrasting $100k and $120k income stacks to show the impact of deductions.

From $100k to $120k: How Much More You Actually Keep

A geometric vector illustration shows a businessman at a crossroads, symbolizing the decision between accepting a counter-offer or leaving.

Counter-Offer Math: Should You Accept or Leave?

A geometric vector illustration for Finluxy showing a person in a suit climbing an ascending golden arrow representing growth.

A $10k Raise at 35: Lifetime Financial Impact

A vector illustration of a US map with upward-pointing arrows, rising bar charts, and scattered dollar coins, framed by two businessmen pointing at the map.

From $80k to $100k: True Take-Home Increase by State

Geometric illustration of a large hand giving a star to a professional on a growth chart, signifying merit.

Merit Increase Data: What Employers Actually Give

Geometric vector illustration of a professional weighing a lightbulb and a growth arrow on a scale, symbolizing personal value.

How to Quantify Your Value Before Negotiating

A stylized vector illustration showing a person climbing steps labeled with age 30 towards large, golden geometric structures.

A $5k Raise at 30: What It’s Worth Over a Career

Geometric illustration comparing career paths: changing jobs with external jumps versus internal promotion steps, showing projected growth in income.

Job Change vs Promotion: Which Pays More Over 5 Years

A geometric vector illustration shows a professional climbing steps of increasing money towards a higher tax bracket level.

When a Raise Pushes You Into a Higher Bracket: Real Cost

A geometric vector illustration showing a clock, growing coin stacks, and arrows symbolizing financial compounding and early career growth.

Compounding a Raise: Why Early Wins Matter Most

Geometric vector map of the United States in teal and gold, featuring a rising arrow and article headline.

$15k Raise Net Take-Home After Taxes by State

A geometric vector illustration shows an increasing value trend for a single dollar over time.

Raise Math Guide: The Lifetime Value of Every Dollar

  • About
  • Privacy Policy
  • Editorial Policy
  • Disclaimer
  • Affiliate Disclosure
  • Terms of Use
  • Contact
© 2026 Finluxy. All Rights Reserved.