 Analysis by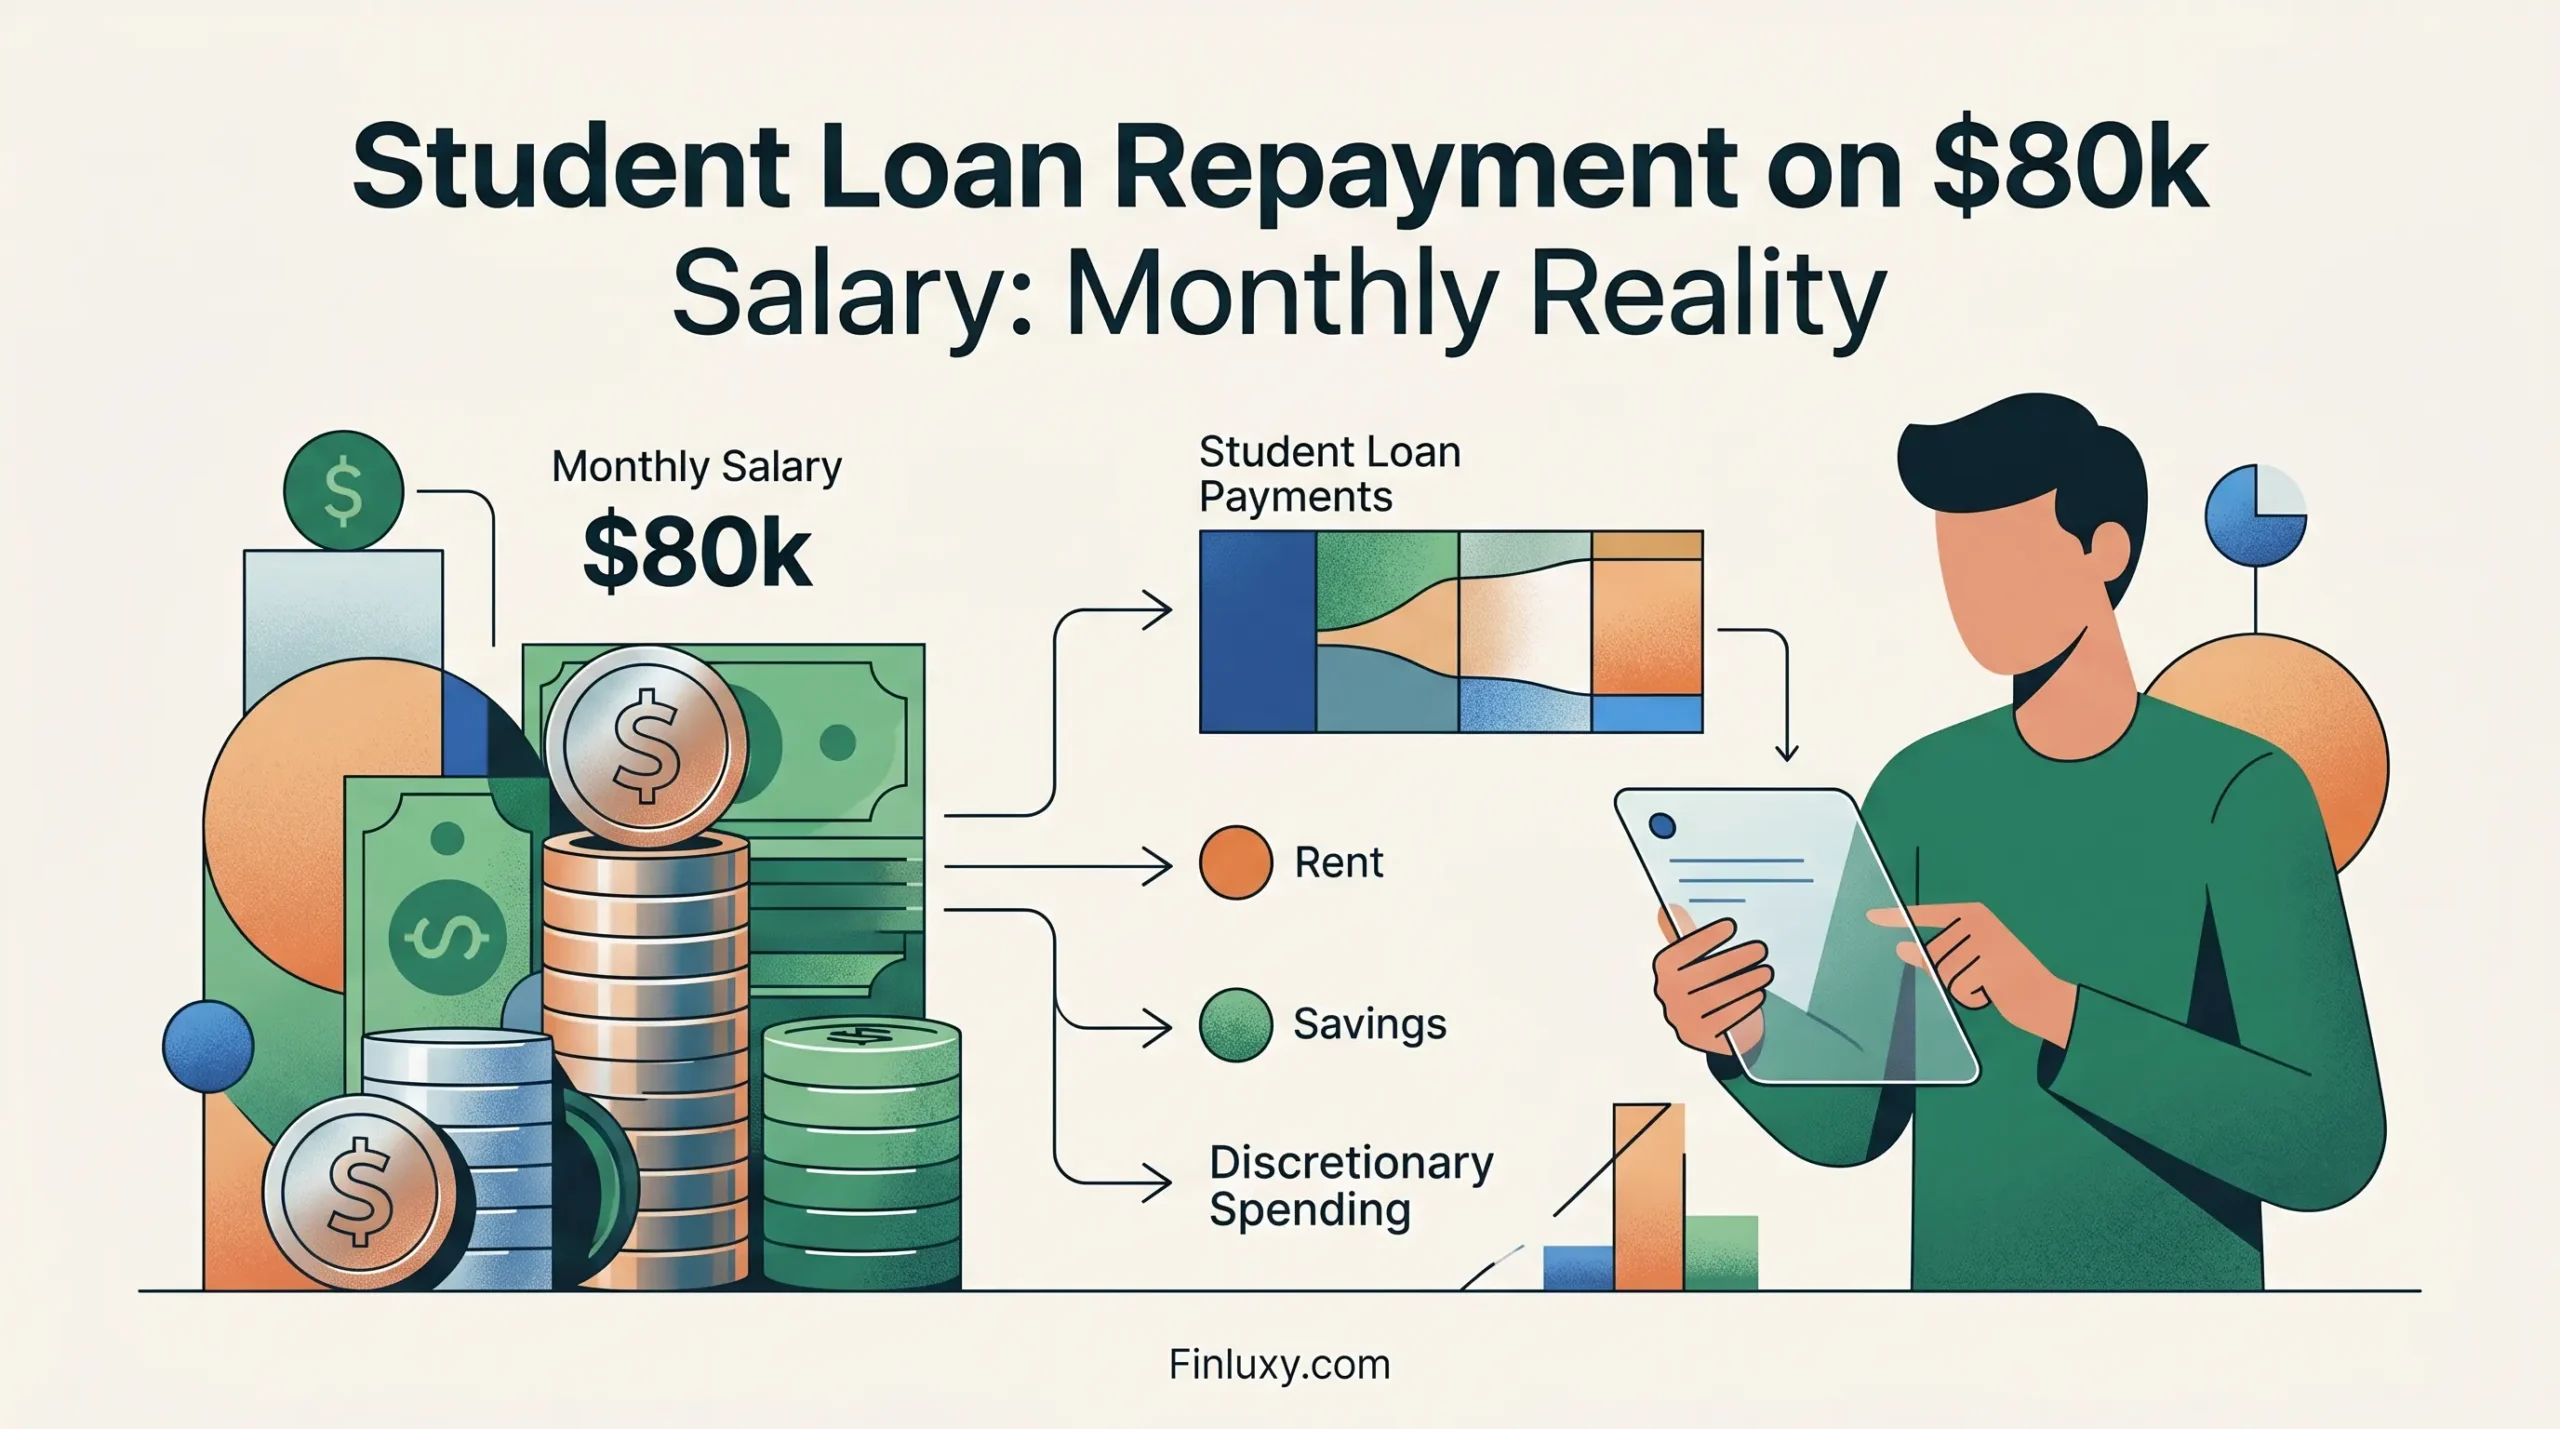
On an $80,000 starting salary, a borrower carrying $80,000 in federal student loans hands over $908 a month to their servicer — 18.5% of take-home pay, before rent, food, or a single retirement contribution. That figure is not a worst-case scenario. It is the standard 10-year repayment outcome for a Class of 2024 engineering graduate who attended an average private nonprofit university.
This analysis uses 2024-25 federal student loan interest rates (6.53% for undergraduate Direct loans already outstanding) confirmed via the U.S. Department of Education’s Federal Student Aid announcements and the Consumer Financial Protection Bureau. New loans disbursed for 2025-26 carry a rate of 6.39%, per the Education Department’s May 2025 announcement. Monthly payment figures are calculated using standard amortization math; they apply to fixed-rate federal Direct loans under the standard repayment framework and do not account for state income taxes, loan fee deductions, or employer repayment benefits. Repayment landscape data reflects the One Big Beautiful Bill Act (P.L. 119-21), signed July 4, 2025, and subsequent regulatory guidance through June 2026. Income-driven repayment options remain in flux — the SAVE plan was vacated by federal court order in March 2026; IBR and the forthcoming Repayment Assistance Plan (RAP, launching July 1, 2026) are the operative income-driven options as of this writing.
Key Numbers at a Glance
| Loan Balance | Monthly Payment | % of $80k Gross Monthly | % of ~$59k Take-Home Monthly | Total Interest Paid |
|---|---|---|---|---|
| $30,000 | $340 | 5.1% | 6.9% | $10,849 |
| $50,000 | $567 | 8.5% | 11.5% | $18,082 |
| $80,000 | $908 | 13.6% | 18.5% | $28,931 |
| $100,000 | $1,135 | 17.0% | 23.1% | $36,164 |
Source: Payment figures calculated using standard loan amortization at 6.53% (Federal Student Aid, 2024-25 rate for undergraduate Direct loans). Take-home estimate for a single filer at $80,000 gross assumes ~2025 federal income tax brackets; no state tax applied. Figures rounded to nearest dollar.
Where the $80k Salary Threshold Comes From
The $80k anchor is not arbitrary. According to the National Association of Colleges and Employers (NACE) Summer 2025 Salary Survey — which reports actual starting salaries for the Class of 2024 — engineering graduates averaged $80,482 and computer science graduates averaged $88,907. Business graduates landed at $65,276. Social sciences and humanities typically fall in the $50,000–$60,000 range depending on employer sector.
An $80,000 salary sits squarely in the range where a borrower earns enough to disqualify themselves from any meaningful income-driven payment reduction under IBR, yet not enough to absorb a large debt payment without significant lifestyle compression. Under “new IBR” (applicable to loans disbursed on or after July 1, 2014), the monthly payment equals 10% of discretionary income — defined as income above 150% of the federal poverty line. For a single borrower in 2025, that threshold is approximately $22,590. On $80,000, the IBR payment calculates to roughly $478 per month, regardless of loan balance. On a $30,000 balance, that is actually higher than the standard 10-year payment of $340. IBR only lowers the payment — and extends the repayment timeline — when the debt is large enough that standard repayment would exceed the income-based cap.
The crossover point on $80k income: student loan math on $100k debt shows IBR becomes favorable only above approximately $65,000–$70,000 in principal, where the standard payment exceeds the $478 IBR figure. Below that threshold, standard repayment costs less and finishes faster.
The Debt Levels That Actually Reach $80k
The median federal student loan balance among all borrowers with outstanding debt was between $20,000 and $24,999, per the Federal Reserve’s 2024 Survey of Economic Well-Being. But medians obscure the distribution that matters most for this analysis. Among the Class of 2024, the average debt at graduation was $29,560 for all four-year degree recipients — $27,420 for public university graduates and $34,420 for private nonprofit graduates, per LendingTree analysis of College Board data.
Reaching $80,000 in undergraduate debt requires either: (a) attending a higher-cost private institution and funding a substantial share through loans, (b) taking five or more years to graduate and borrowing each year, or (c) layering graduate debt on top of undergraduate balances. At a private nonprofit institution with a 2024-25 full cost of attendance (COA) of $62,990 (College Board, 2024), four years produces $251,960 in total COA. Families at $150k+ income receive negligible need-based aid at most institutions — meaning the gap between what the household can pay and what is borrowed drives the debt load. A family that can cover $40,000 per year but borrows the remainder across four years at a $63k-COA institution carries roughly $92,000 at graduation, before interest accrues during any grace period.
Graduate borrowing creates a separate, larger problem. The One Big Beautiful Bill Act (P.L. 119-21, signed July 4, 2025) capped graduate student federal borrowing at $100,000 lifetime for new borrowers starting July 1, 2026. Combined undergraduate and graduate debt above $100,000 is not unusual — as of July 2025, 3.6 million borrowers held over $100,000 in federal student loans alone, per Federal Student Aid portfolio data.
Repayment Plan Reality in 2026
The repayment landscape has changed significantly. The SAVE plan — which had been the most borrower-favorable income-driven option — was eliminated by the One Big Beautiful Bill Act and formally vacated by federal court order in March 2026. Borrowers in SAVE received servicer notices beginning July 1, 2026, instructing them to exit the plan within 90 days.
Three active repayment structures now apply to most borrowers with loans originated before July 1, 2026:
Standard repayment — previously a universal 10-year term — becomes tiered under the new law for new loans: borrowers with balances under $25,000 remain on a 10-year term; those with $25,000–$49,999 move to 15 years; $50,000–$99,999 get 20 years; $100,000 or more extends to 25 years. This applies to loans disbursed on or after July 1, 2026. Existing loans remain on the original 10-year standard.
New IBR continues for borrowers with loans disbursed before July 1, 2026. Monthly payments equal 10% of discretionary income, with forgiveness after 20 years. The One Big Beautiful Bill Act removed the partial financial hardship requirement, meaning higher-income borrowers who previously didn’t qualify can now enroll. The catch: forgiven balances are taxable as ordinary income starting January 1, 2026 — a structural shift that significantly changes the math on long-term IBR strategies. A borrower who enrolls in IBR at $80k income and rides it for 20 years may face a six-figure tax bill in the year of forgiveness.
Repayment Assistance Plan (RAP) launches July 1, 2026. It caps monthly payments based on adjusted gross income and family size and offers forgiveness after 30 years — but that 30-year timeline is longer than both new IBR (20 years) and old IBR (25 years). Details on the RAP payment formula were still being finalized by the Education Department at the time of publication; readers should verify current terms at StudentAid.gov before enrolling.
For context on how institution type drives the debt load leading to these repayment decisions, see the true net cost gap between public and private universities.
The Monthly Budget Reality
A single borrower earning $80,000 gross takes home approximately $59,000 annually after federal income tax — roughly $4,917 per month. That calculation does not subtract Social Security and Medicare taxes (another ~7.65%), bringing effective take-home closer to $54,000, or $4,500 per month. The table below uses the more conservative $4,500 monthly figure.
| Loan Balance | Monthly Payment (10-yr, 6.53%) | % of Monthly Take-Home | Remaining After Loan Payment | IBR Alternative (10% discretionary) |
|---|---|---|---|---|
| $30,000 | $340 | 7.6% | $4,160 | $478 (IBR higher — use standard) |
| $50,000 | $567 | 12.6% | $3,933 | $478 (IBR lower by $89/mo) |
| $80,000 | $908 | 20.2% | $3,592 | $478 (IBR lower by $430/mo) |
| $100,000 | $1,135 | 25.2% | $3,365 | $478 (IBR lower by $657/mo) |
Source: Monthly payments calculated at 6.53% using standard amortization (Federal Student Aid, 2024-25 rate). Take-home estimate assumes single filer, $80,000 gross, 2025 federal income tax brackets, standard deduction, plus FICA taxes (~7.65%). IBR calculation: 10% × ($80,000 − $22,590) ÷ 12 = $478/month (150% FPL for single person, 2025 federal poverty guidelines). All figures rounded.
The $80,000 balance row is the stress point. A 20% loan-to-take-home ratio leaves $3,592 per month for rent, food, transportation, retirement contributions, and any other savings. In most major metro areas where starting salaries of $80,000 are concentrated — New York, San Francisco, Boston, Seattle — median one-bedroom rents exceed $2,000. That leaves approximately $1,592 for everything else. The standard financial planning benchmark for student loan payments is under 10% of gross monthly income — the $80k balance breaks that threshold by a factor of two.
Finluxy College Investment Ratio
The Finluxy College Investment Ratio expresses the relationship between total 4-year net cost of attendance and the median starting salary in a graduate’s likely career field — in years of starting salary required to cover the degree cost. Under 1.5 years signals strong return on investment; above 4.0 years indicates financial risk that is heavily dependent on career certainty and salary trajectory.
| Scenario | 4-Year Net COA | Median Starting Salary (Major Field) | Finluxy College Investment Ratio | Risk Signal |
|---|---|---|---|---|
| Public in-state, engineering | $119,640 | $80,482 | 1.49 years | Strong ROI |
| Private nonprofit, engineering | $251,960 | $80,482 | 3.13 years | Moderate — monitor debt load |
| Private nonprofit, business | $251,960 | $65,276 | 3.86 years | Elevated — career certainty required |
| Private nonprofit, humanities/social sciences | $251,960 | $55,000* | 4.58 years | High financial risk |
4-year COA: public in-state uses $29,910/year (College Board, Trends in College Pricing and Student Aid 2024, 2024-25 data); private nonprofit uses $62,990/year (same source). These are sticker-price COA figures applied to $150k+ households where need-based aid is negligible. Starting salaries: engineering $80,482, business $65,276 from NACE Summer 2025 Salary Survey (Class of 2024 actuals). *Humanities/social sciences $55,000 is a segment-average estimate per NACE 2025 Winter Salary Survey projections; model-specific data by field varies. Finluxy College Investment Ratio = 4-year net COA ÷ median starting salary for the institution’s top major.
The public in-state engineering path barely clears the 1.5-year strong-ROI threshold at 1.49. Add one year of loan interest accrual during a grace period and that ratio edges above 1.5. The private nonprofit engineering path at 3.13 years is financially defensible only if the borrower reaches above-median salary within 3–5 years — a reasonable assumption in engineering, less certain in most other fields. Humanities at a private institution at 4.58 years requires either family wealth covering most of the COA (which changes the analysis entirely), exceptional career outcomes, or public service employment qualifying for PSLF. For families comparing school types, the income outcomes data for prestigious versus state schools complicate any simple recommendation.
The Overlooked Variable: Salary Growth Rate
Most repayment analyses hold salary constant. That is wrong in a way that understates how quickly the payment burden can normalize — and overstates how useful income-driven repayment actually is for high earners.
An $80,000 starting salary in engineering typically reaches $95,000–$105,000 within three to four years of experience, per BLS Occupational Employment data and PayScale College ROI reporting. At $95,000 gross, the same $908 payment on an $80,000 loan represents 11.5% of take-home rather than 20%. By year five at $110,000, it is under 10%. The 10-year standard repayment term aligns with a career trajectory that largely solves the burden problem through salary growth — provided the borrower does not add new debt (car loans, mortgage, graduate school) simultaneously.
IBR, by contrast, keeps the payment low early but increases it as income rises. A borrower who starts IBR at $478/month and reaches $120,000 income by year seven faces an IBR payment of approximately $813/month at that point — while still carrying the original loan balance, now grown larger if early payments didn’t cover accruing interest. The extended timeline under IBR also means that forgiven balance at year 20 is taxable. A borrower who entered IBR on $80,000 in loans and had modest income growth might reach forgiveness with $40,000–$60,000 remaining — triggering a $10,000–$20,000 tax bill in that year at typical marginal rates. This is the forgiveness tax bomb that most coverage of income-driven repayment underweights.
For families navigating the upstream decision of how much to fund through 529 plans versus loans, that forgiveness tax exposure shifts the math considerably.
Practical Context for $150k+ Households
A household earning $150,000 or more is unlikely to be the borrower facing these repayment figures — it is more likely to be the parent evaluating how much debt to allow a student to carry, or the parent whose child is now on an $80,000 starting salary and struggling to reconcile loan payments with basic living costs in an expensive city.
The core data point: at $80,000 in student debt, the standard 10-year payment consumes more than 20% of take-home pay in the first years of a career. That is the equivalent of a second rent payment in a moderately priced market. The decision frame for $150k+ parents is whether to fund more of the COA during college — either from cash flow, 529 distributions, or Parent PLUS loans — to reduce the graduate’s debt burden, or to allow the debt and trust in salary trajectory.
Parent PLUS loans complicate this further. Under the One Big Beautiful Bill Act, Parent PLUS borrowers who do not consolidate their loans before June 30, 2026, lose access to most income-driven repayment options after July 1, 2028. Families who borrowed through Parent PLUS and planned on IDR relief need to act before that deadline. For a full comparison of how institutional choice affects the debt outcome at $150k+ income, see the comprehensive college cost guide for $150k+ families and the breakdown of Ivy League net price at $175k household income.
At the planning level: a 529 funded aggressively enough to cover 50% of projected COA cuts the likely loan balance roughly in half — moving a borrower from the $80,000 stress zone into the $40,000 range where standard repayment is meaningful but not crippling. The 529 contribution math by child’s age at $100k income and the higher-income equivalent for $150k+ households both show that early funding compresses the debt exposure substantially. The prepaid tuition plan versus 529 growth plan comparison is worth reviewing for families making this funding decision now.
For those evaluating graduate school as the next step — where debt loads routinely reach $100,000–$200,000 — the same salary-relative framework applies with higher stakes. The MBA, law, and medical school ROI comparison runs those numbers against field-specific starting salaries. And for families who funded their undergraduate degree with out-of-state tuition costs, the out-of-state versus in-state true cost gap shows where that additional borrowing originated. Understanding financial aid reality at $200k+ income matters most at the front end of this decision — before the loans exist — since merit aid assumptions and family contribution planning affect how large a debt load a student carries into that first $80k salary.
Frequently Asked Questions
What is the monthly payment on $80,000 in student loans at a $80,000 salary?
Under the standard 10-year repayment plan at the 2024-25 undergraduate federal loan rate of 6.53%, the monthly payment on an $80,000 balance is $908. That represents approximately 13.6% of $80,000 gross monthly income and roughly 20% of estimated take-home pay after federal income tax and payroll taxes for a single filer. IBR would reduce this to approximately $478/month based on 10% of discretionary income above 150% of the federal poverty line — but at the cost of extending repayment to 20 years and exposing any forgiven balance to ordinary income tax as of January 2026.
Is $80,000 in student loan debt a lot for an $80,000 salary?
By the standard financial planning benchmark — student loan payments should not exceed 10% of gross monthly income — an $80,000 balance at a 6.53% rate produces a payment that exceeds the threshold by approximately 36%. The Finluxy College Investment Ratio for this debt-to-salary relationship sits at roughly 1.0 if the $80,000 was the full cost of the degree (unlikely at a private institution), but the ratio climbs above 3.0 when factoring in a full 4-year private nonprofit COA. Whether it’s “too much” depends on the salary growth trajectory of the specific career field — engineering and computer science typically resolve the burden within 3–5 years of advancement; humanities and social sciences fields carry higher sustained risk.
What happens to income-driven repayment plans in 2026?
The SAVE plan was vacated by federal court order in March 2026 and eliminated by the One Big Beautiful Bill Act (signed July 4, 2025). The Repayment Assistance Plan (RAP) launches July 1, 2026 as the primary new IDR option, with payments capped based on income and forgiveness after 30 years. IBR remains available for borrowers with loans disbursed before July 1, 2026, with the partial financial hardship requirement removed. PAYE and ICR are scheduled to sunset July 1, 2028. Critically, any loan balance forgiven through an IDR plan on or after January 1, 2026 is treated as taxable ordinary income, reversing the prior tax exclusion.
Should a borrower on $80k choose IBR or standard repayment?
The data-driven answer depends on loan balance. Below approximately $55,000–$65,000 in federal debt, the standard 10-year payment is lower than the IBR payment of ~$478/month on an $80k income — making standard repayment both faster and cheaper. Above roughly $65,000 in debt, IBR reduces the monthly payment but extends the timeline and subjects any remaining forgiven balance to income tax at year 20. For borrowers with strong salary growth expectations — engineering, technology, finance — standard repayment often wins on total cost. For borrowers in fields with flatter salary trajectories or those pursuing PSLF (Public Service Loan Forgiveness), IBR remains the more appropriate structure, though PSLF rules and tax treatment should be verified at StudentAid.gov given the pace of regulatory change.
Methodology
Monthly payment figures were calculated using standard loan amortization math (M = P × [r(1+r)^n] / [(1+r)^n − 1]) applied to the 2024-25 undergraduate Direct loan interest rate of 6.53%, confirmed via Federal Student Aid announcements and CFPB reporting. The 2025-26 rate of 6.39% (per the Education Department’s May 2025 announcement) is noted where relevant. Take-home pay estimates use 2025 federal income tax brackets and the standard deduction for a single filer at $80,000 gross, plus FICA taxes of 7.65%; no state income tax is applied, as this varies widely by state. IBR payment is calculated as 10% of income above 150% of the 2025 federal poverty guideline for a single-person household ($22,590). Cost of attendance figures are enrollment-weighted averages from College Board’s Trends in College Pricing and Student Aid 2024 (for 2024-25 data) and the 2025 report (for 2025-26 data). Starting salary figures are actuals from the NACE Summer 2025 Salary Survey for the Class of 2024. Repayment plan landscape reflects the One Big Beautiful Bill Act (P.L. 119-21, July 4, 2025) and court orders through March 2026, sourced from Federal Student Aid, the Institute for College Access & Success, and legal analysis published by studentloanborrowerassistance.org. The Finluxy College Investment Ratio is calculated as 4-year net COA at sticker price (appropriate for $150k+ households with negligible need-based aid eligibility) divided by median starting salary for the relevant major field, expressed in years.
Sources & References
- College Board — Trends in College Pricing and Student Aid 2024 and 2025
- Consumer Financial Protection Bureau — Student Loan Interest Rate Analysis 2024-25
- NerdWallet — Federal Student Loan Rates 2025-26 (citing Education Department announcement, May 2025)
- Federal Reserve — Report on Economic Well-Being of U.S. Households 2024 (Student Loans section)
- NACE — Summer 2025 Salary Survey, Class of 2024 Starting Salaries
- LendingTree — Student Loan Debt Statistics (Class of 2024 average debt figures)
- Institute for College Access & Success — Student Loan News and Repayment Plan Updates, updated March 2026
- Student Loan Borrower Assistance — One Big Beautiful Bill Act Summary for Borrowers
- The Motley Fool — Federal Student Loan Portfolio Data, December 2025
- University of Maryland Extension — Federal Student Loan Reform 2025-2028 Guide
- Federal Student Aid — Dear Colleague Letter: One Big Beautiful Bill Act Provisions, July 2025