 Analysis by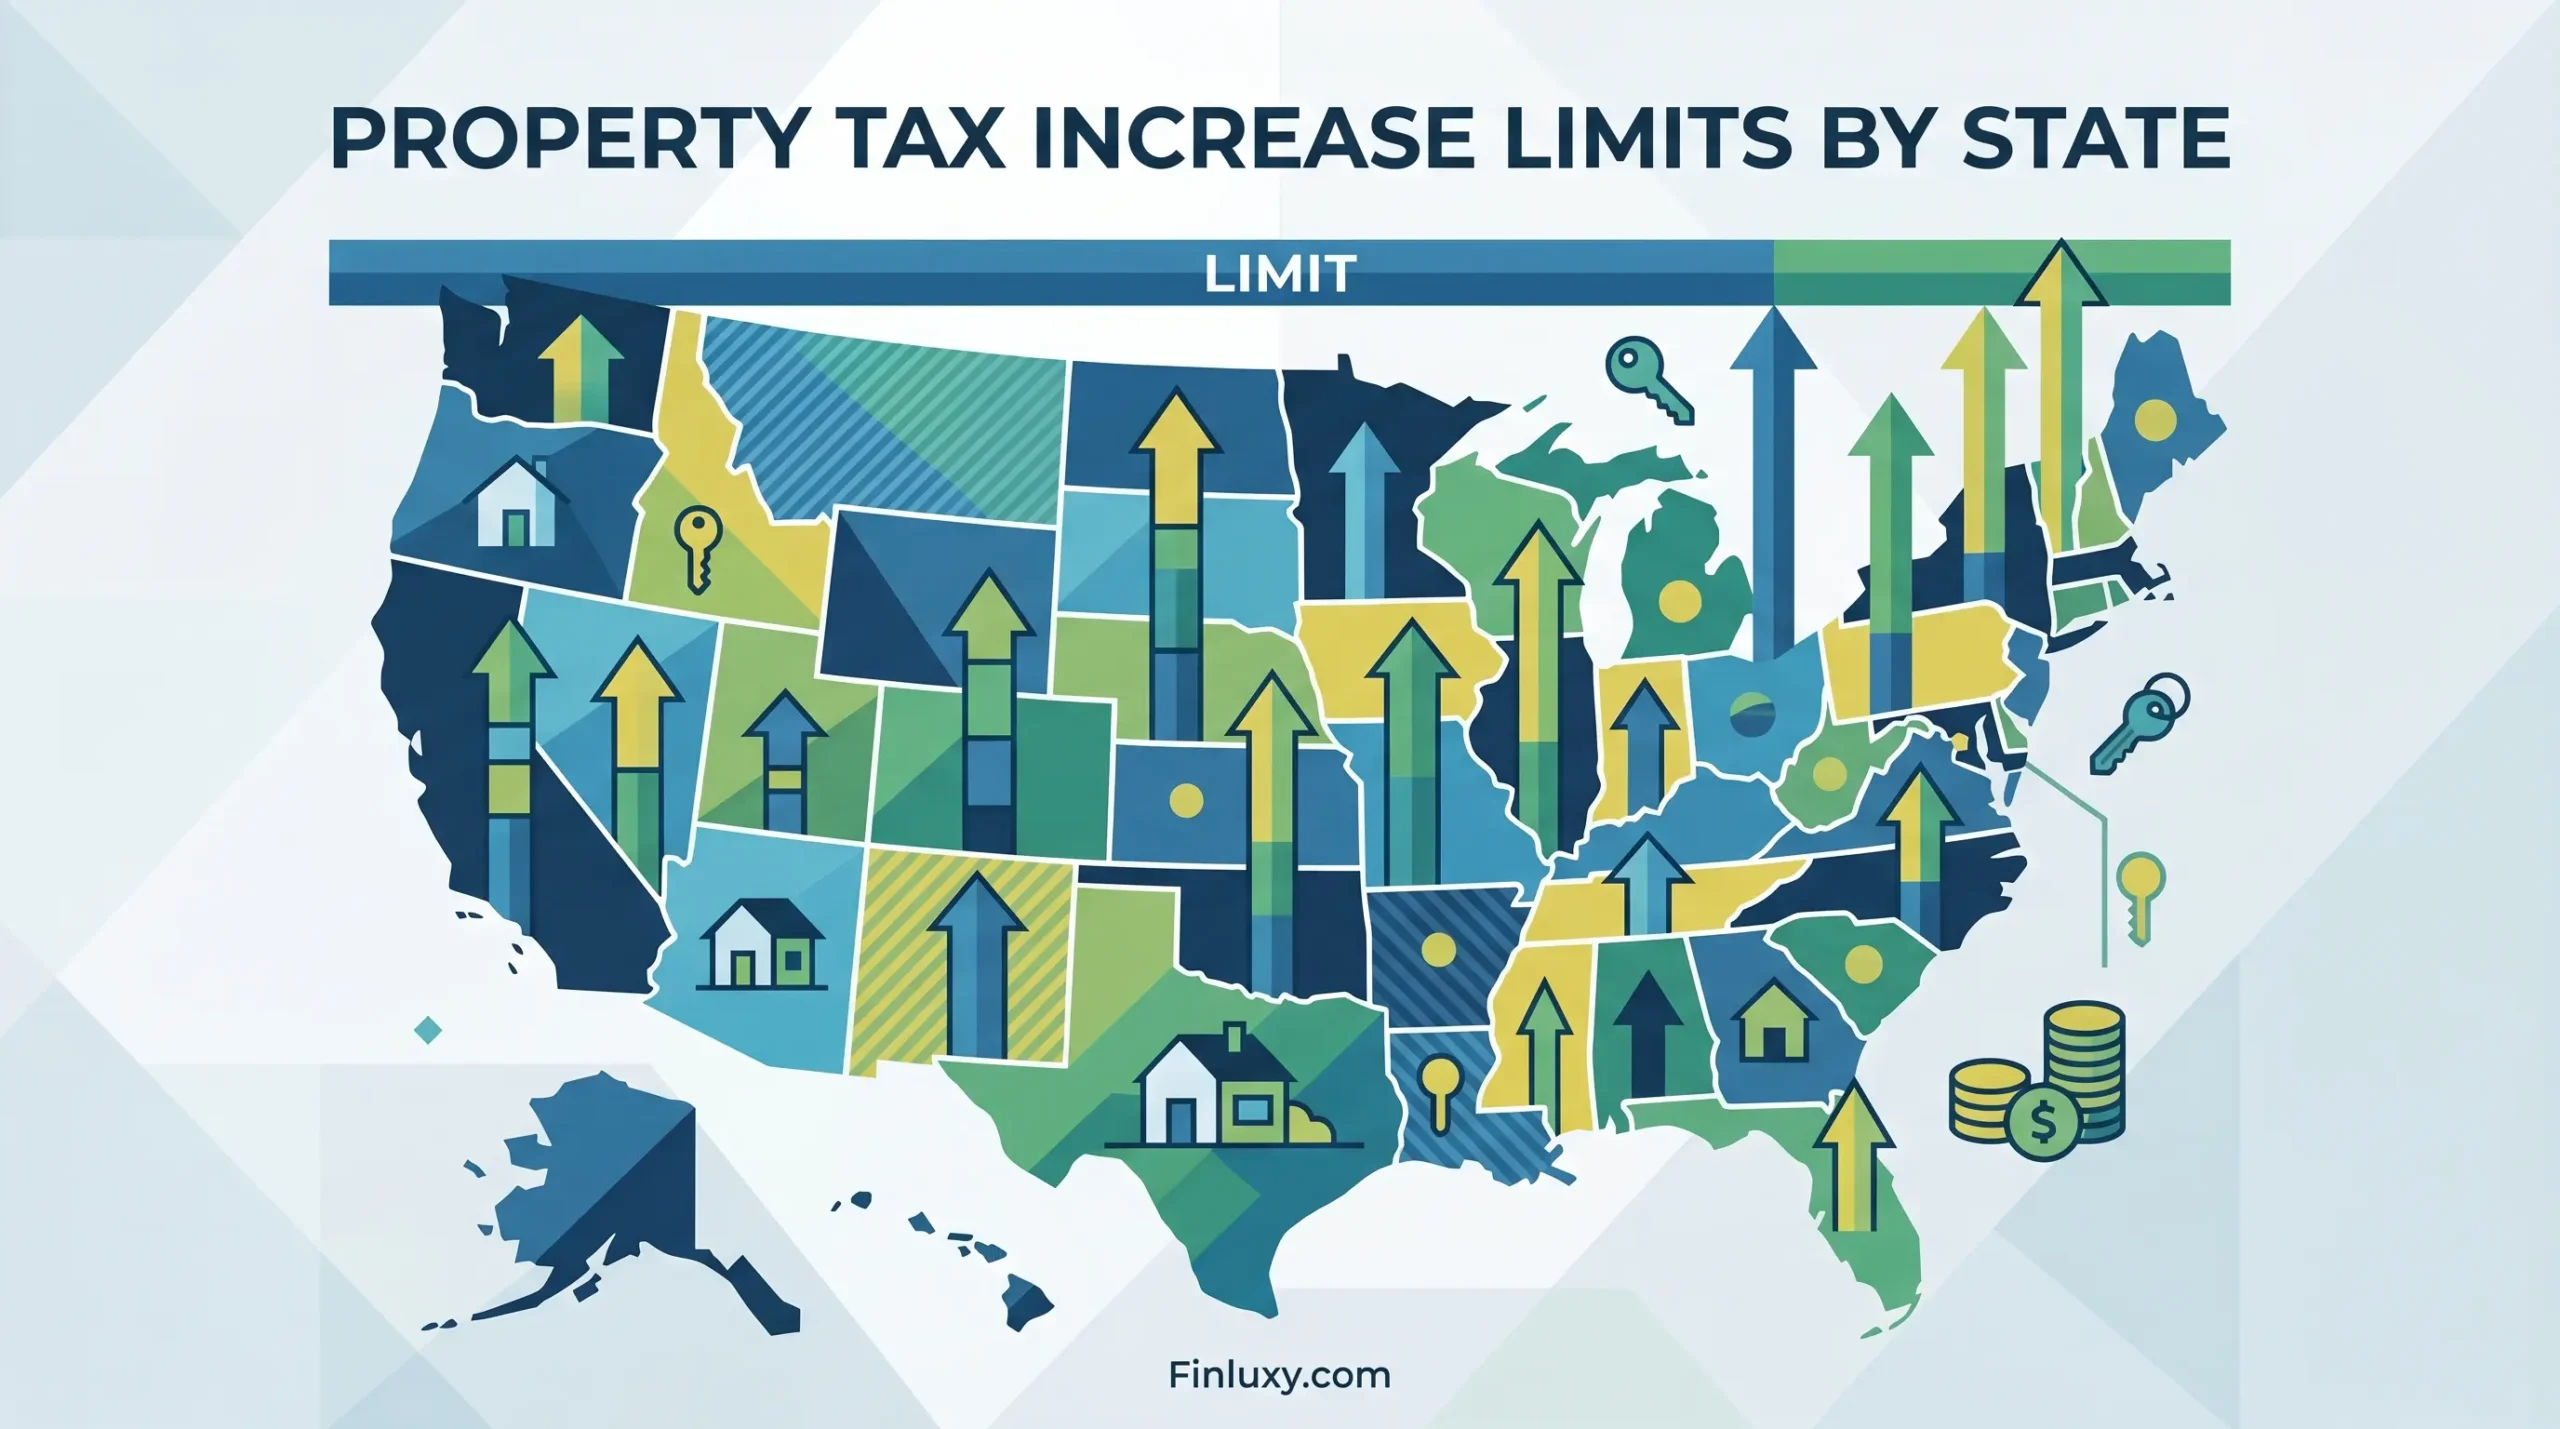
California limits how much a homeowner’s taxable value can rise each year to 2 percent. Texas allows five times that — 10 percent — and roughly a dozen states impose no statutory limit at all. That spread, not the headline tax rate, is what determines whether a $150k+ household faces a predictable bill or a six-figure surprise after a hot market cycle.
Property tax increase limits — caps on how fast a property’s assessed value or taxable value can grow year over year — are the most underdiscussed variable in homeownership cost. Most buyers compare the effective property tax rate by county and stop there. The assessment cap is what decides whether that rate applies to a number anchored near your purchase price or one that floats up with the market every January.
Scope: This guide covers statutory assessment increase limits (also called assessment caps) for owner-occupied primary residences across selected US states, drawn from state constitutions, tax codes, and county assessor and comptroller publications. Cap mechanics differ for non-homestead, commercial, and newly purchased property, and most caps reset to market value on sale or new construction — those resets are noted but not exhaustively modeled. Rate and threshold figures reflect the most recent confirmed data as of mid-2026; statutory caps are stable but income thresholds and CPI-linked limits adjust annually. This is cost analysis, not tax or legal advice. Verify your specific parcel’s status with your county assessor.
The numbers that matter most
Five figures frame this entire analysis. The cap percentage tells you the ceiling on annual taxable-value growth; the national median effective tax rate gives you a baseline to judge whether a low cap is protecting a high rate or a low one.
| Figure | Value |
|---|---|
| Lowest statutory assessment cap (California, Prop 13) | 2% per year |
| Florida Save Our Homes cap (homestead) | 3% or CPI, whichever is lower (2.9% for 2025) |
| Texas homestead appraisal cap | 10% per year |
| National median effective tax rate (Finluxy Index baseline) | 1.08% |
| SALT deduction cap, 2025–2029 (OBBBA) | $40,000, phasing to $10,000 above $500,000 MAGI |
Sources: California State Board of Equalization; Florida Department of Revenue; Texas Comptroller; Lincoln Institute of Land Policy / Tax Foundation (Index baseline); IRS / One Big Beautiful Bill Act, July 2025.
How assessment caps actually work
An assessment cap does not limit your tax bill. It limits one input to that bill: the assessed value (in some states called taxable value or capped appraised value), which is the figure the tax rate gets multiplied against. Market value — what the home would sell for — is distinct, and in capped states the two numbers drift apart over time as the market outruns the cap. The gap between them is the protection.
California sets the template. Proposition 13, adopted in 1978, holds the general property tax rate at 1 percent of assessed value and limits annual increases in that assessed value to 2 percent, or the change in the California Consumer Price Index, whichever is lower, per the California State Board of Equalization. A property reassesses to full market value only on change of ownership or new construction. That single mechanic explains why a longtime owner in Palo Alto can pay a fraction of what the buyer next door pays for an identical house — the cap follows the property, then resets on sale. The structure is worth understanding in detail before any luxury purchase in the state, because the reset on resale is exactly where the Prop 13 luxury buyer math turns against new entrants.
Texas runs a looser version. The Texas Comptroller, under Tax Code Section 23.23(a), caps the annual increase in a residence homestead’s appraised value at 10 percent above the prior year’s appraised value, plus the value of any new improvements. The cap does not take effect until January 1 of the year after a homeowner first qualifies for the homestead exemption, leaving a gap year fully exposed to market value. Texas also created a temporary 20 percent circuit-breaker cap for non-homestead real property valued at or below a CPI-indexed threshold — $5.32 million for 2026, up from $5.16 million in 2025 and $5 million in 2024 — set to expire after the 2026 tax year unless extended. Note the legal term: Texas uses “protest,” not appeal, for challenging an assessment, which matters when filing before the May 15 deadline.
Florida splits the difference. The Save Our Homes amendment, approved by voters in 1992 and administered by the Florida Department of Revenue, limits annual assessed-value increases on homestead property to 3 percent or the change in CPI, whichever is lower. For tax year 2025 the applied cap was 2.9 percent. Non-homestead property in Florida carries a separate 10 percent cap, excluding school district taxes.
The cap landscape by state
Below are the statutory limits for primary-residence homesteads in markets where $150k+ households concentrate. The mechanics vary enough that a flat percentage comparison hides as much as it reveals — read the reset and exemption columns alongside the cap.
| State / Jurisdiction | Annual cap on assessed value | Resets to market value on sale? | Statutory authority |
|---|---|---|---|
| California | 2% (or CPI, lesser) | Yes | Prop 13, Cal. Const. Art. XIII A |
| Florida | 3% (or CPI, lesser); 2.9% for 2025 | Yes | Save Our Homes, FL Const. / §193.155 |
| New York City (Class 1) | 6% per year; 20% over 5 years | No (cap follows parcel) | NY RPTL §1805; NYC Admin. Code §11-208.1 |
| Texas | 10% (homestead) | Yes | TX Tax Code §23.23(a) |
| Texas (non-homestead, ≤$5.32M) | 20% circuit breaker (through 2026) | Yes | TX Tax Code §23.231 |
| No statutory cap (e.g., much of the Midwest and Northeast outside NY/NJ caps) | None — assessed value can track full market value | n/a | State-specific reassessment cycles |
Sources: California State Board of Equalization (Pub. 800); Florida Department of Revenue (Save Our Homes, rev. Jan 2026); NYC Department of Finance; Texas Comptroller (Valuing Property). Figures confirmed mid-2026.
New York City deserves its own line because its cap is the most counterintuitive. For Class 1 properties — one-to-three-family homes — New York Real Property Tax Law §1805 bars the assessor from raising assessed value more than 6 percent in any single year or 20 percent over any five-year period, regardless of how fast market value climbs. Unlike California, Texas, and Florida, the NYC cap does not reset on sale; it follows the parcel. A buyer inherits the seller’s suppressed assessed value, which is why a $2 million brownstone in a fast-appreciating Brooklyn neighborhood can carry an assessed value detached from its sale price for years. That structure interacts heavily with the NYC mansion tax and property tax calculation at the high end.
The Finluxy Property Tax Burden Index
A cap percentage means nothing without the rate it modifies. The Finluxy Property Tax Burden Index isolates that by dividing a market’s effective tax rate by the national median effective rate of 1.08 percent (Lincoln Institute of Land Policy / Tax Foundation). An index of 1.0 sits at the national median; above 1.5 marks a high-tax market; below 0.5 marks a low-tax one. A tight assessment cap on top of a high effective rate — New Jersey, parts of Texas — protects the trajectory of the bill but not its altitude.
| State | Effective tax rate | Finluxy Property Tax Burden Index | Reading |
|---|---|---|---|
| New Jersey | 2.08% | 1.93× | High-tax market |
| Illinois | 1.95% | 1.81× | High-tax market |
| Texas | 1.47% | 1.36× | Above median |
| National median | 1.08% | 1.00× | At median |
| California | 0.71% | 0.66× | Below median |
| Hawaii | 0.26% | 0.24× | Low-tax market |
Effective tax rates: Tax Foundation (owner-occupied, 2022 data, most recent county-level series). Index calculated against 1.08% national median per Lincoln Institute / Tax Foundation. California’s low effective rate reflects the Prop 13 acquisition-value system, not low statutory rates.
The index exposes the inverse relationship most coverage misses. California pairs the nation’s tightest assessment cap with one of its lowest effective rates — an index of 0.66× — because the 2 percent cap, compounded over decades, suppresses the assessed-value base far below market. New Jersey, with no comparable statewide cap, sits at 1.93×. Texas lands at 1.36× even with a 10 percent homestead cap, because the cap restrains the base while local rates stay high. A cap and a low burden are not the same thing.
What the SALT change did to the cap math
Here is what most property-tax coverage from before mid-2025 now gets wrong. The state and local tax (SALT) deduction cap, frozen at $10,000 since the 2017 Tax Cuts and Jobs Act, was raised by the One Big Beautiful Bill Act, signed July 2025, to $40,000 for tax years 2025 through 2029 ($40,400 for 2026). That changes the federal calculus for $150k+ households in high-cap, high-rate states more than any assessment cap does.
Under the old $10,000 cap, a New Jersey household paying $19,000 in property tax plus state income tax blew through the limit on property tax alone — every marginal dollar of property tax above the cap delivered zero federal benefit. At $40,000, that same household can now deduct a far larger share, and the marginal value of property tax paid below the combined ceiling returns. The catch: the expanded cap phases down by 30 percent of modified adjusted gross income (MAGI) above $500,000, flooring at $10,000. A household at $560,000 MAGI sees the cap cut to roughly $22,000. The full mechanics of that interaction sit in the SALT cap property tax deduction analysis, and they materially change whether a high-tax, low-cap state is as expensive after-tax as it looks before.
Modeling a cap failure: the appeal lever
Caps limit growth; they do not guarantee accuracy. When assessed value exceeds true market value — common after a downturn, or when an assessor over-applies a cap year after year — the correction comes through a property tax appeal (a protest, in Texas). The savings model is direct: over-assessment multiplied by the effective tax rate equals annual savings if corrected.
Take a Texas homestead assessed at $1.1 million against a true market value of $1.0 million — a $100,000 over-assessment — in a jurisdiction with a 2.2 percent effective rate. The annual overpayment is $2,200, recurring every year the error persists, because next year’s 10 percent cap compounds off the inflated base. Correcting it resets the trajectory, not just one bill. That compounding is why a successful property tax assessment appeal is worth more in a capped state than the single-year number suggests: the cap that was supposed to protect you instead locks in the error. Understanding the gap between market value versus assessed value is the prerequisite to spotting whether you have a case.
The overlooked insight: low caps disguise high lifetime cost for new buyers
The data shows something the cap-percentage rankings invert. A low cap is framed as buyer protection, but for a new entrant it functions as the opposite. In California, the 2 percent cap protects whoever already owns the home — and because the property resets to full market value on sale, the buyer starts at today’s price, then watches longtime neighbors pay taxes anchored to 1990s valuations. The tightest cap in the country delivers the least benefit to the person writing the largest check. New York City’s parcel-following cap is the mirror image: it does not reset on sale, so a buyer there inherits a suppressed base. Same headline mechanism, opposite outcome for a $150k+ household entering the market. The question is never “how low is the cap” — it is “does the cap reset on me.”
Does a property tax increase limit cap my actual tax bill?
No. Assessment caps limit growth in assessed (or taxable) value — one input to the bill. Local taxing authorities can still raise the tax rate, and most caps exclude new construction and reset to full market value on sale. Your bill can rise even when the cap holds.
Which states have no property tax increase limit?
Roughly a dozen states impose no statutory homestead assessment cap, relying instead on periodic reassessment cycles. In those states, assessed value can track full market value at each reassessment. New Jersey and Illinois — both high effective-rate states — lack the kind of statewide homestead cap California and Florida use.
Does the cap reset when I buy a home?
In California, Florida, and Texas, yes — the property reassesses to market value on change of ownership, so a buyer starts fresh at the purchase price. In New York City (Class 1), the cap follows the parcel and does not reset on sale, so a buyer inherits the prior owner’s suppressed assessed value. This distinction drives lifetime cost more than the cap percentage itself.
How did the 2025 SALT change affect property tax deductibility?
The One Big Beautiful Bill Act raised the SALT deduction cap from $10,000 to $40,000 for 2025–2029 ($40,400 for 2026), with a phase-down to $10,000 for MAGI above $500,000. For itemizing $150k+ households in high-tax states, more property tax now produces federal benefit than under the prior $10,000 cap.
Methodology
Statutory cap figures were drawn directly from primary government sources: the California State Board of Equalization (Publication 800) for Prop 13; the Florida Department of Revenue Save Our Homes documentation; the Texas Comptroller’s Valuing Property guidance and Tax Code Sections 23.23 and 23.231; and New York Real Property Tax Law §1805 with NYC Department of Finance Class 1 materials. Every cap percentage, threshold, and effective date was verified against the issuing agency rather than secondary aggregators.
Effective tax rates used in the Finluxy Property Tax Burden Index come from Tax Foundation owner-occupied data (2022, the most recent complete county-level series) and Lincoln Institute of Land Policy effective-rate research; the Lincoln Institute’s 2024 report places the average effective rate on a median-valued homestead across the 53 largest cities at 1.22 percent, while the Index baseline of 1.08 percent reflects the national median rate. The Index for each state was computed as the state effective rate divided by 1.08 percent. SALT figures reflect the One Big Beautiful Bill Act as enacted July 2025 and IRS guidance for 2025–2026. Where statutory and CPI-linked figures differ by year (Florida’s 2.9 percent 2025 cap, Texas’s annually indexed circuit-breaker threshold), the year is noted inline.
What this means for a $150k+ household
For a household at this income level, the assessment cap should reorder how you weigh a purchase, not just reassure you. Three decisions follow from the data. First, in reset-on-sale states — California, Florida, Texas — model your tax from your purchase price, not from the seller’s current bill, because the cap protects them and resets on you; the seller’s low number is the trap, not the offer. Second, weigh the cap against the effective rate using the Burden Index: a 10 percent Texas cap on a 1.36× burden is a different proposition than a 2 percent California cap on a 0.66× burden, and the after-tax gap narrowed further once the SALT cap rose to $40,000 — though if your MAGI clears $500,000, the phase-down claws much of that back. Third, in any capped state, treat an inflated assessment as a compounding liability rather than a one-year annoyance, since next year’s cap multiplies off this year’s base; a single successful appeal resets the entire forward trajectory. The household that reads the cap as a feature of the house rather than a feature of the prior owner is the one that overpays for a decade. This is where a parcel-specific review with your county assessor, and for high-MAGI filers a sit-down on the SALT phase-down, earns its cost — the thresholds are specific enough that general rules of thumb stop working above $500,000.
Sources & References
- California State Board of Equalization, Publication 800 — Prop 13 assessment rules and 2% cap
- Florida Department of Revenue — Save Our Homes 3%/CPI cap (rev. Jan 2026)
- Texas Comptroller — Valuing Property, homestead 10% cap (Tax Code §23.23)
- NYC Department of Finance — Class 1 Guide, 6%/20% assessment caps
- Tax Foundation — Property Taxes by State and County, effective rates
- Lincoln Institute of Land Policy — Variation in Effective Property Tax Rates report
- Bipartisan Policy Center — SALT deduction changes under OBBBA
- Thomson Reuters — SALT deduction overview, 2025–2026 cap figures