Skip to content
Finluxy
Finluxy
  • Affluent Living
  • Income Reality
  • Life & Money
  • Luxury Spending
  • Real Estate
  • Smart Spending
  • Tax & Wealth

Deal Math

A deal is only a deal if it saves you money on something you would have bought anyway, at a price that reflects the item’s actual value to you, without triggering additional spending you wouldn’t otherwise have made. Each of those conditions eliminates a large percentage of promotional offers that appear in the market as deals but function primarily as tools for driving spending by sellers.

Percentage-off framing is the most common deal presentation and the most susceptible to anchor manipulation. A 40% discount off a suggested retail price that was never a realistic market price represents no savings. Luxury goods, jewelry, and electronics are particularly prone to inflated “original prices” that make the discount appear larger than the actual reduction from market value. The useful comparison is always to the market price of comparable items, not to the promoted original price.

Bundle math is worth evaluating explicitly. A bundle that combines three items for $150 when purchased individually they’d cost $180 is a 17% savings — but only if you’d buy all three items separately. If you’d only use two of them, the effective price of the two useful items is $150, which may be more expensive than buying them individually. Streaming bundles, software packages, and membership tiers all use bundle logic to capture spending that individual item pricing wouldn’t generate.

Buy-one-get-one (BOGO) and volume discount offers warrant particular scrutiny. Buying three months of a service for the price of two is only advantageous if you’d have subscribed for three months anyway — and if you cancel after the promotional period expires, the per-month cost may be identical to the standard rate. For the psychological underpinnings of why deals feel compelling regardless of their mathematical merit, see pricing psychology. The Smart Spending pillar covers deal evaluation as part of a broader framework for intentional financial decision-making.

A geometric vector illustration contrasting real versus manufactured outlet discounts with money bags and a magnifying glass.

Outlet Store Math: Real vs Manufactured Discounts

Geometric infographic comparing used and new car costs with vectors of a blue sedan and a green EV.

Used vs New Car at $100k Income: 5-Year True Cost

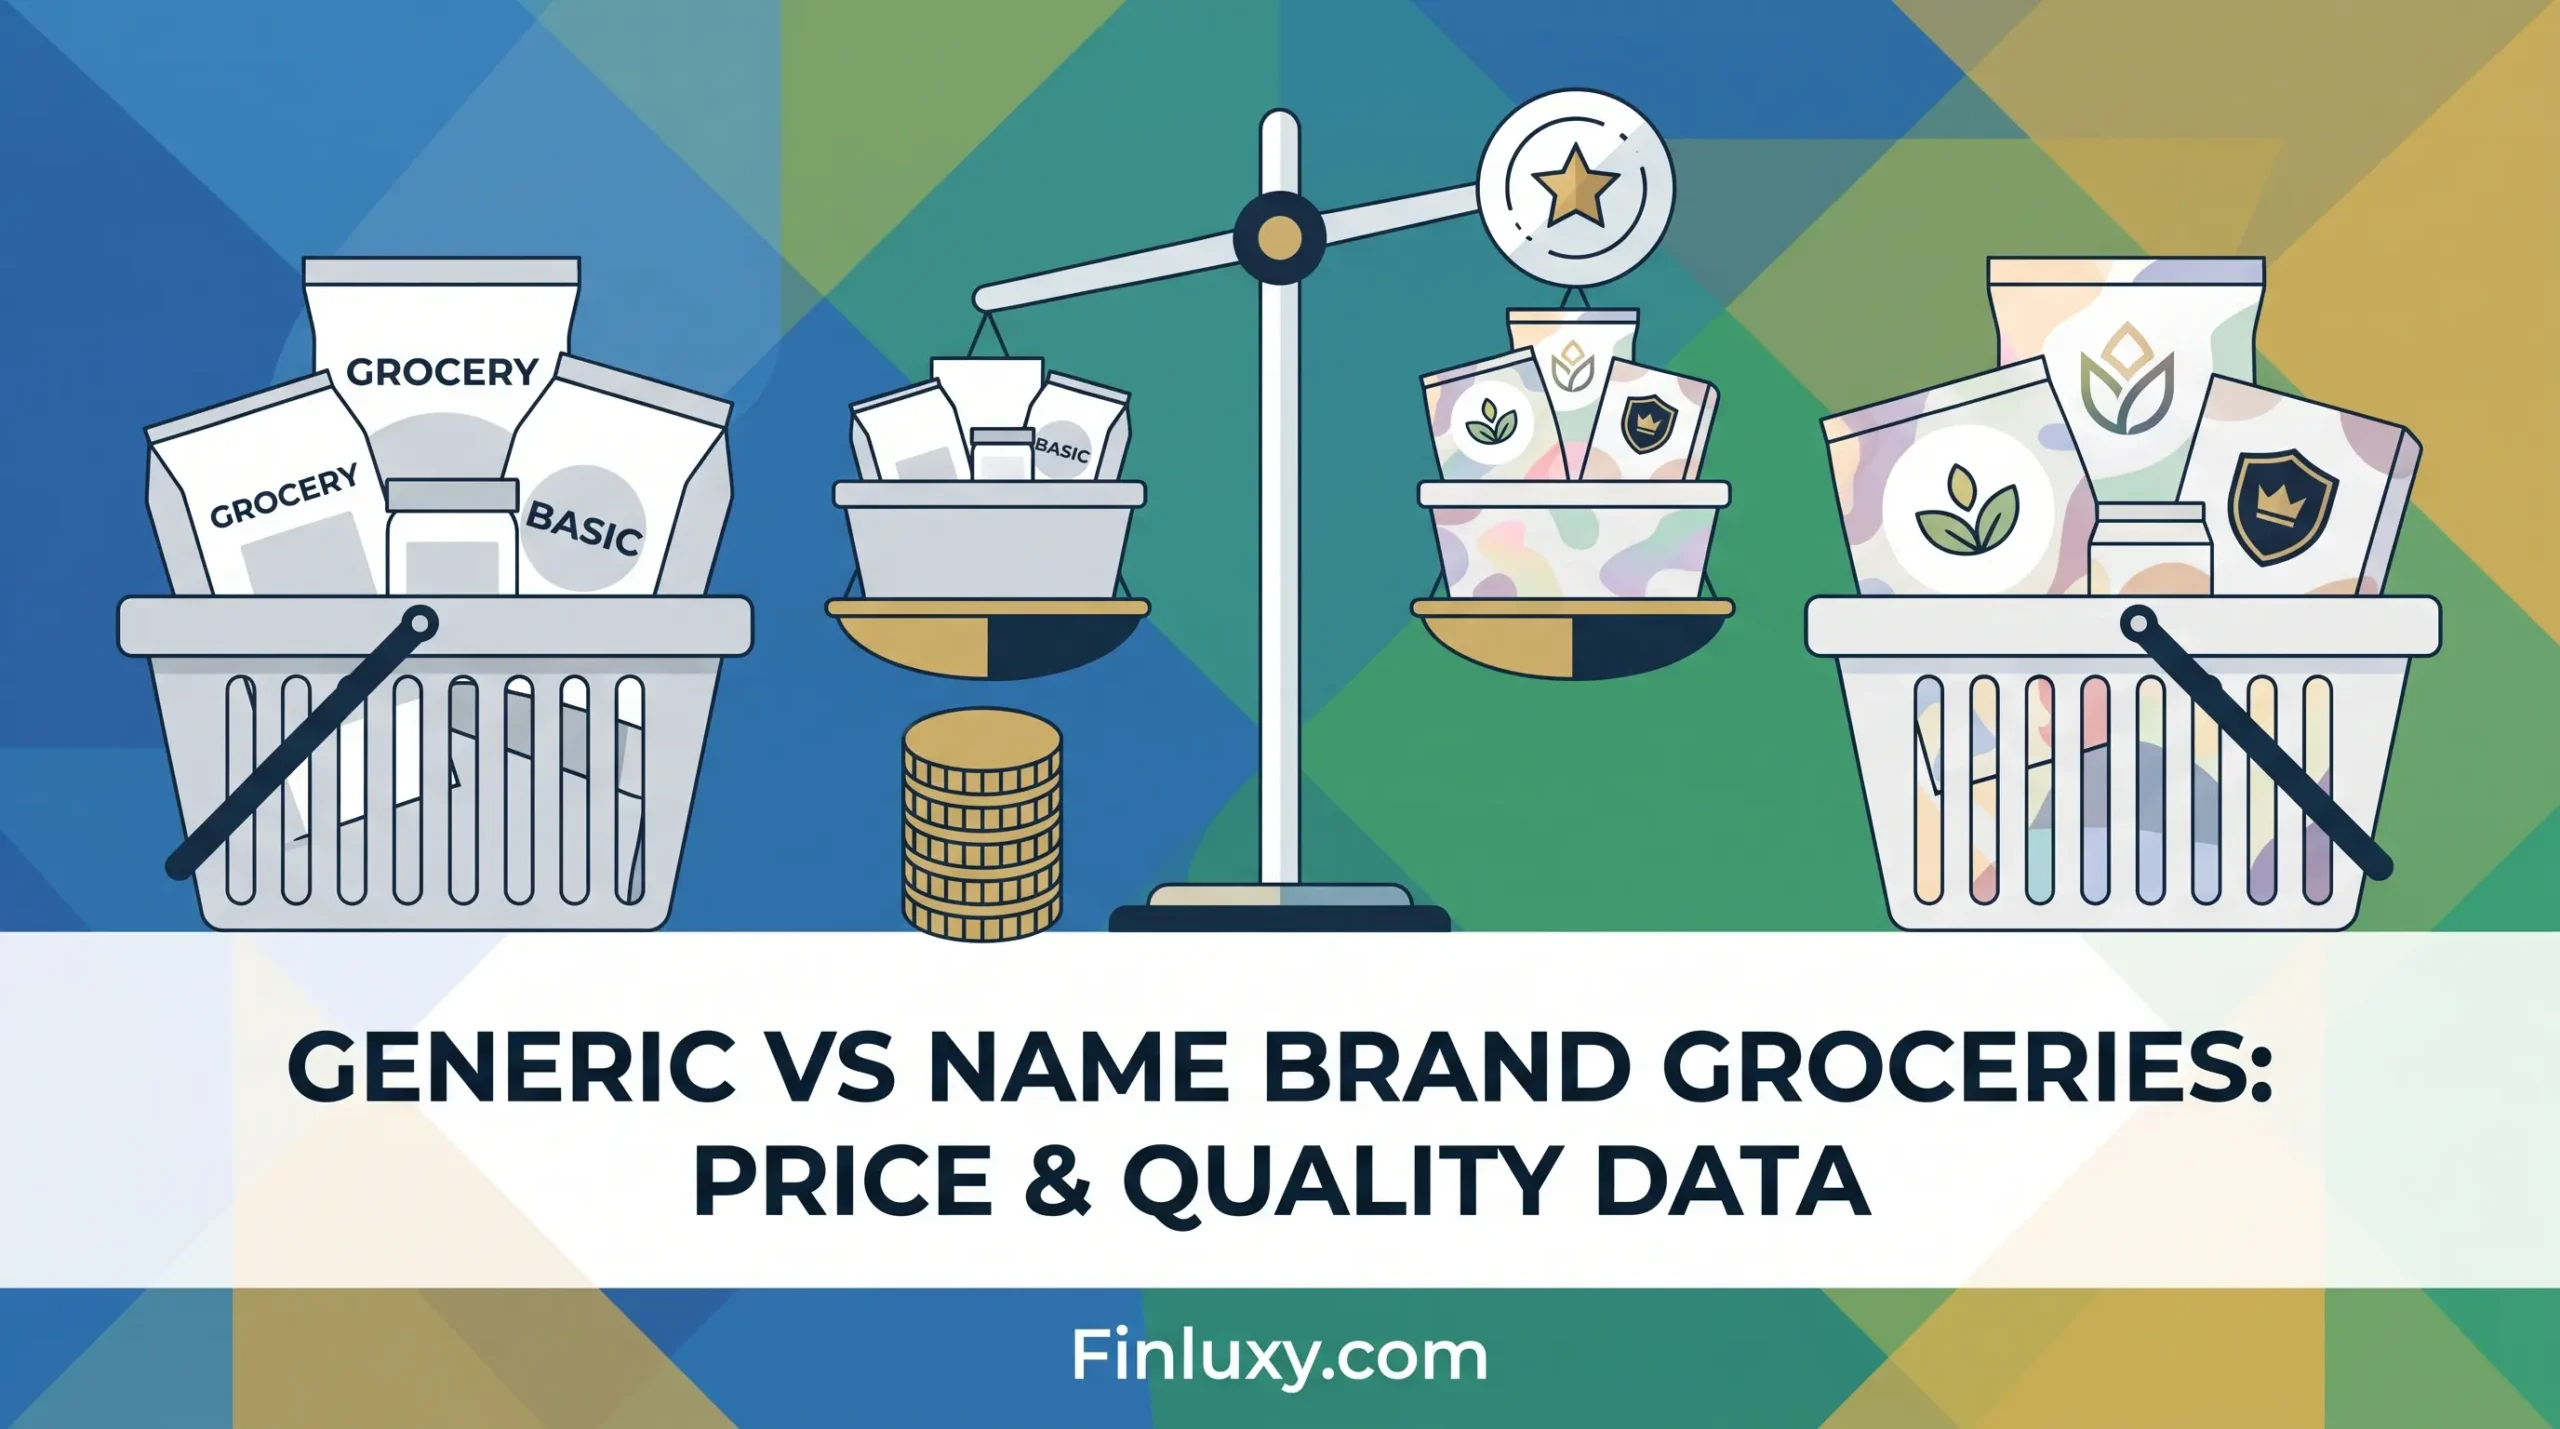
A modern vector illustration comparing generic and name brand groceries on a balancing scale, featuring the Finluxy logo.

Generic vs Name Brand Groceries: Price and Quality Data

Annual Sale Calendar: When Each Category Is Cheapest

Geometric illustration about bulk buying savings, featuring coins, shopping carts, and a growing money plant with Finluxy.com logo.

Bulk Buying Math: When Buying More Actually Saves

Abstract geometric vector illustration comparing regular pricing and Black Friday sales using stylized curves and a price tag.

Black Friday vs Regular Price: Historical Price Data

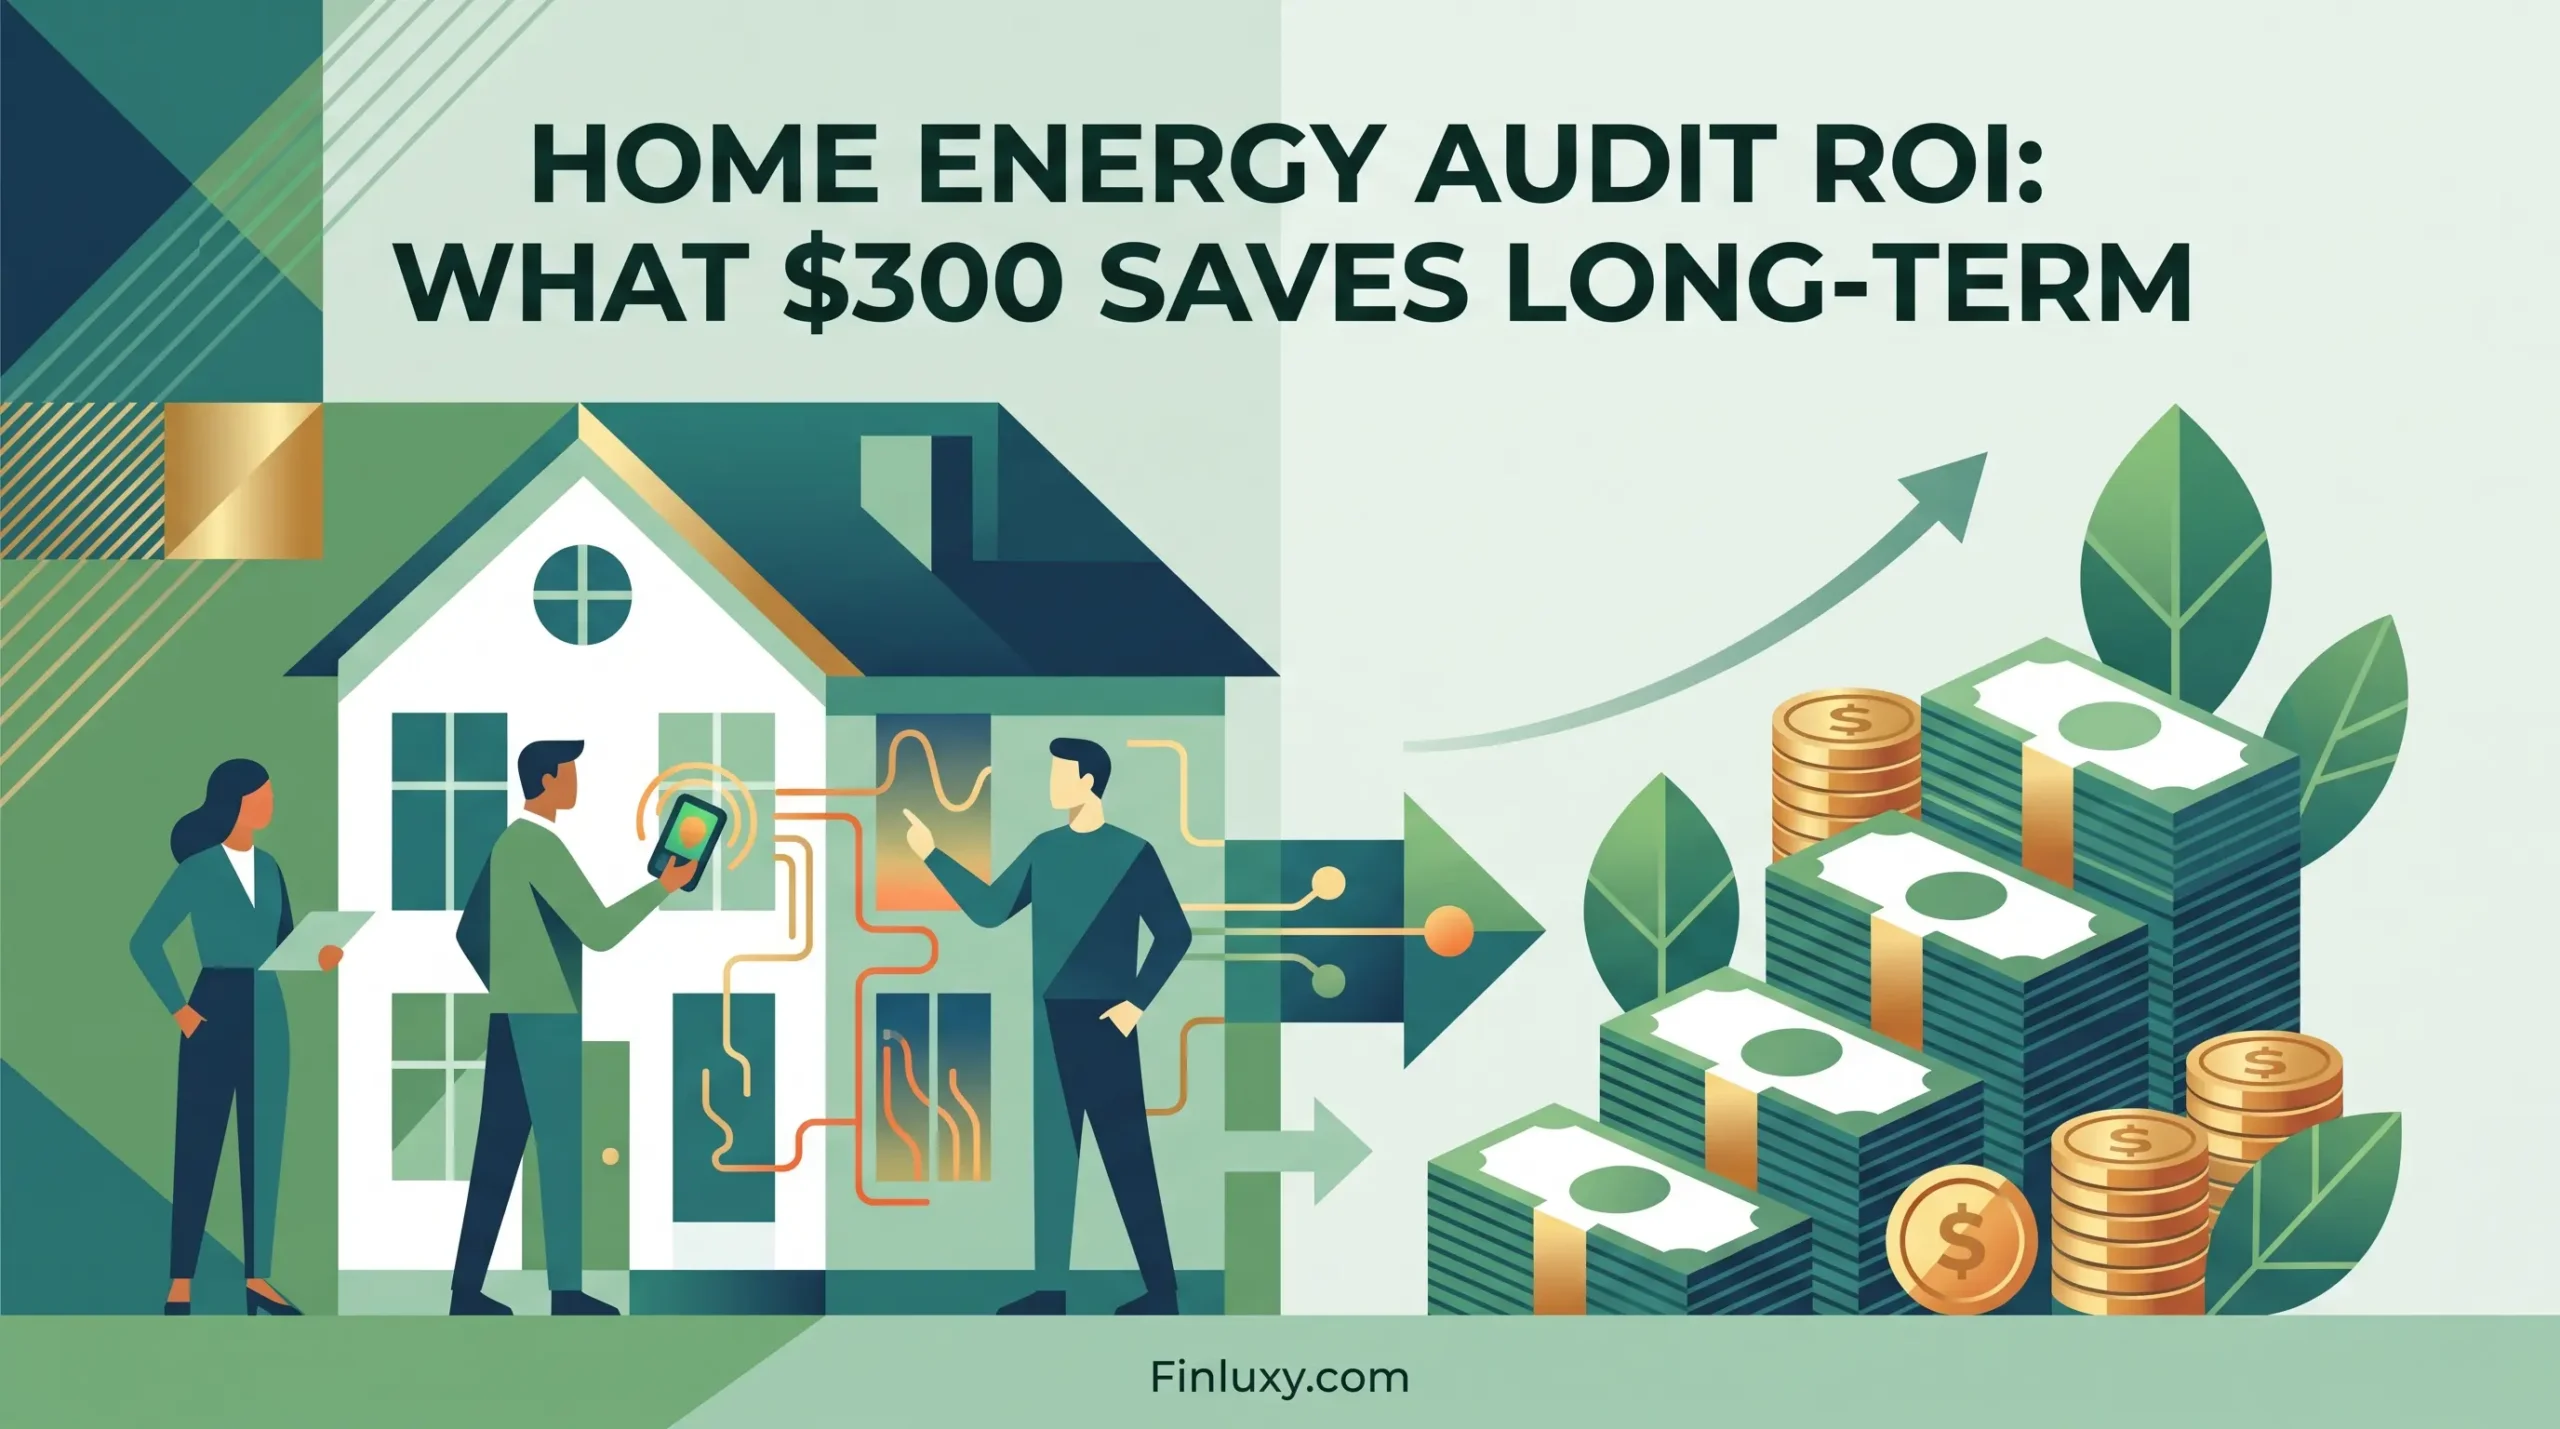
Geometric vector illustration of a home energy audit leading to a growing stack of money and leaves.

Home Energy Audit ROI: What $300 Saves Long-Term

Stylized vector illustration of two business professionals discussing fees with a bridge and arrows symbolizing successful negotiation.

Negotiating Professional Service Fees: What Works

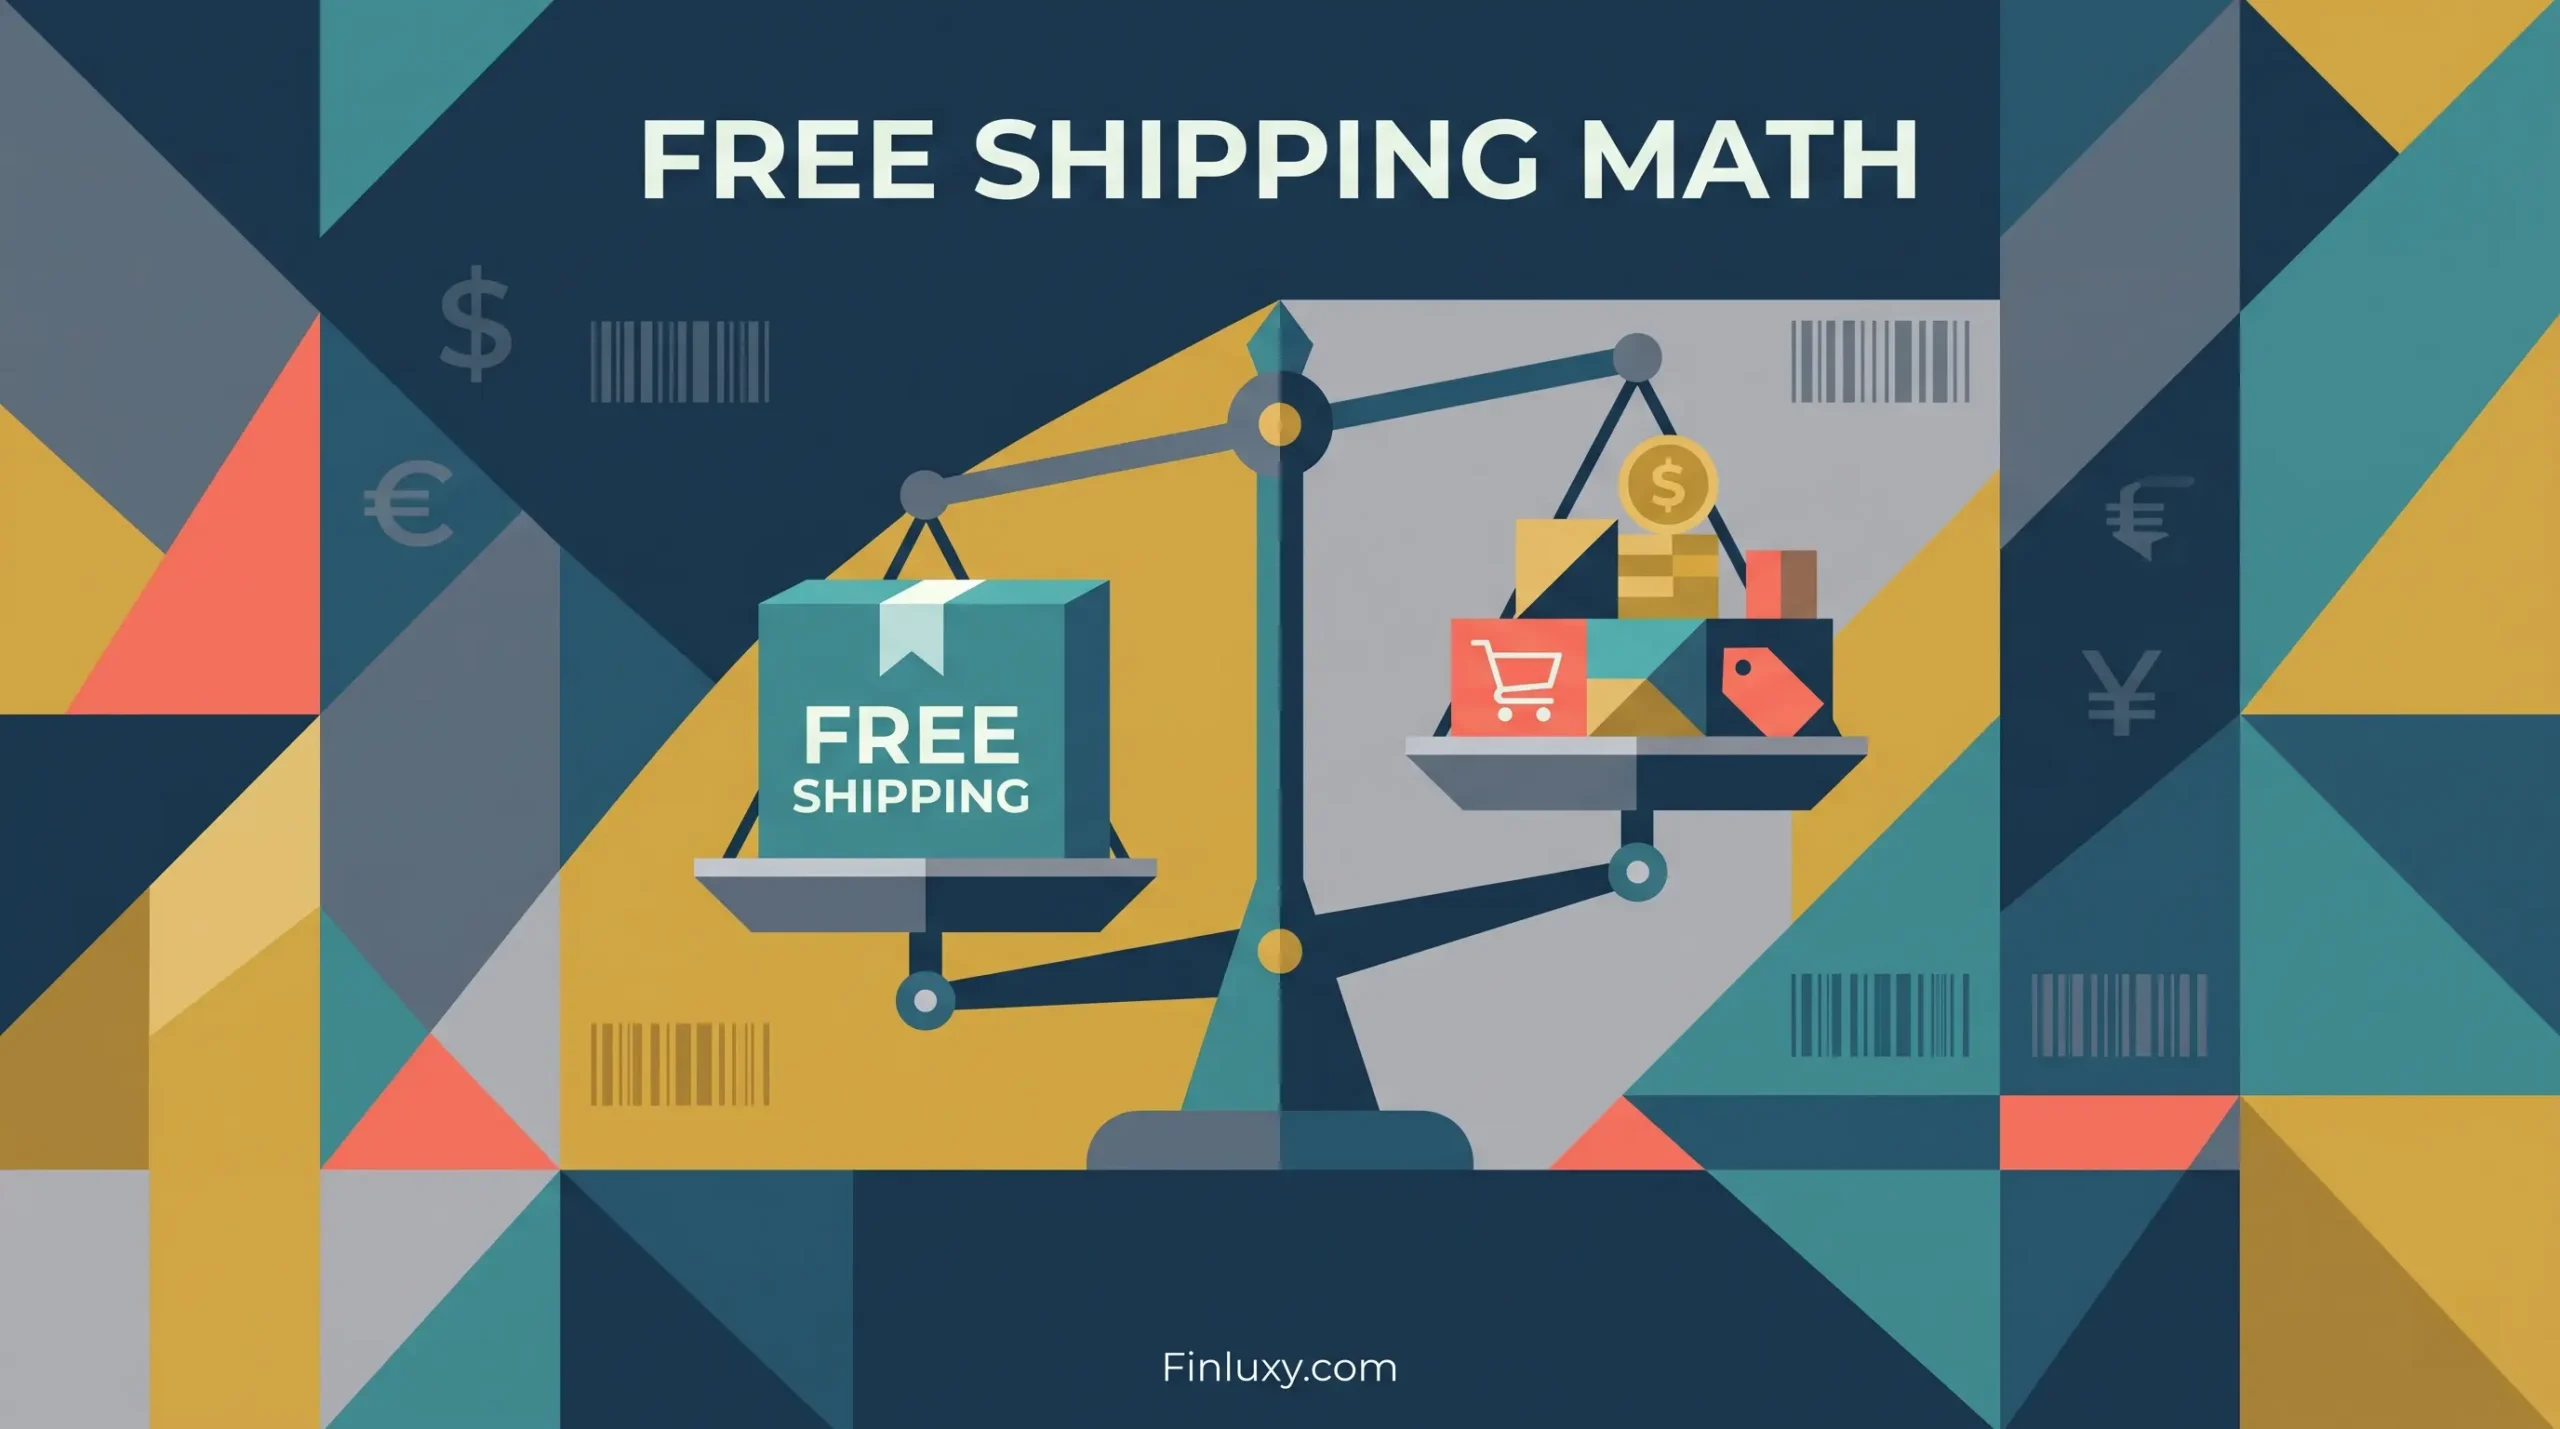
A geometric illustration of a balance scale with "FREE SHIPPING" boxes, representing the true cost of shipping.

Free Shipping Math: When It’s Not Actually Free

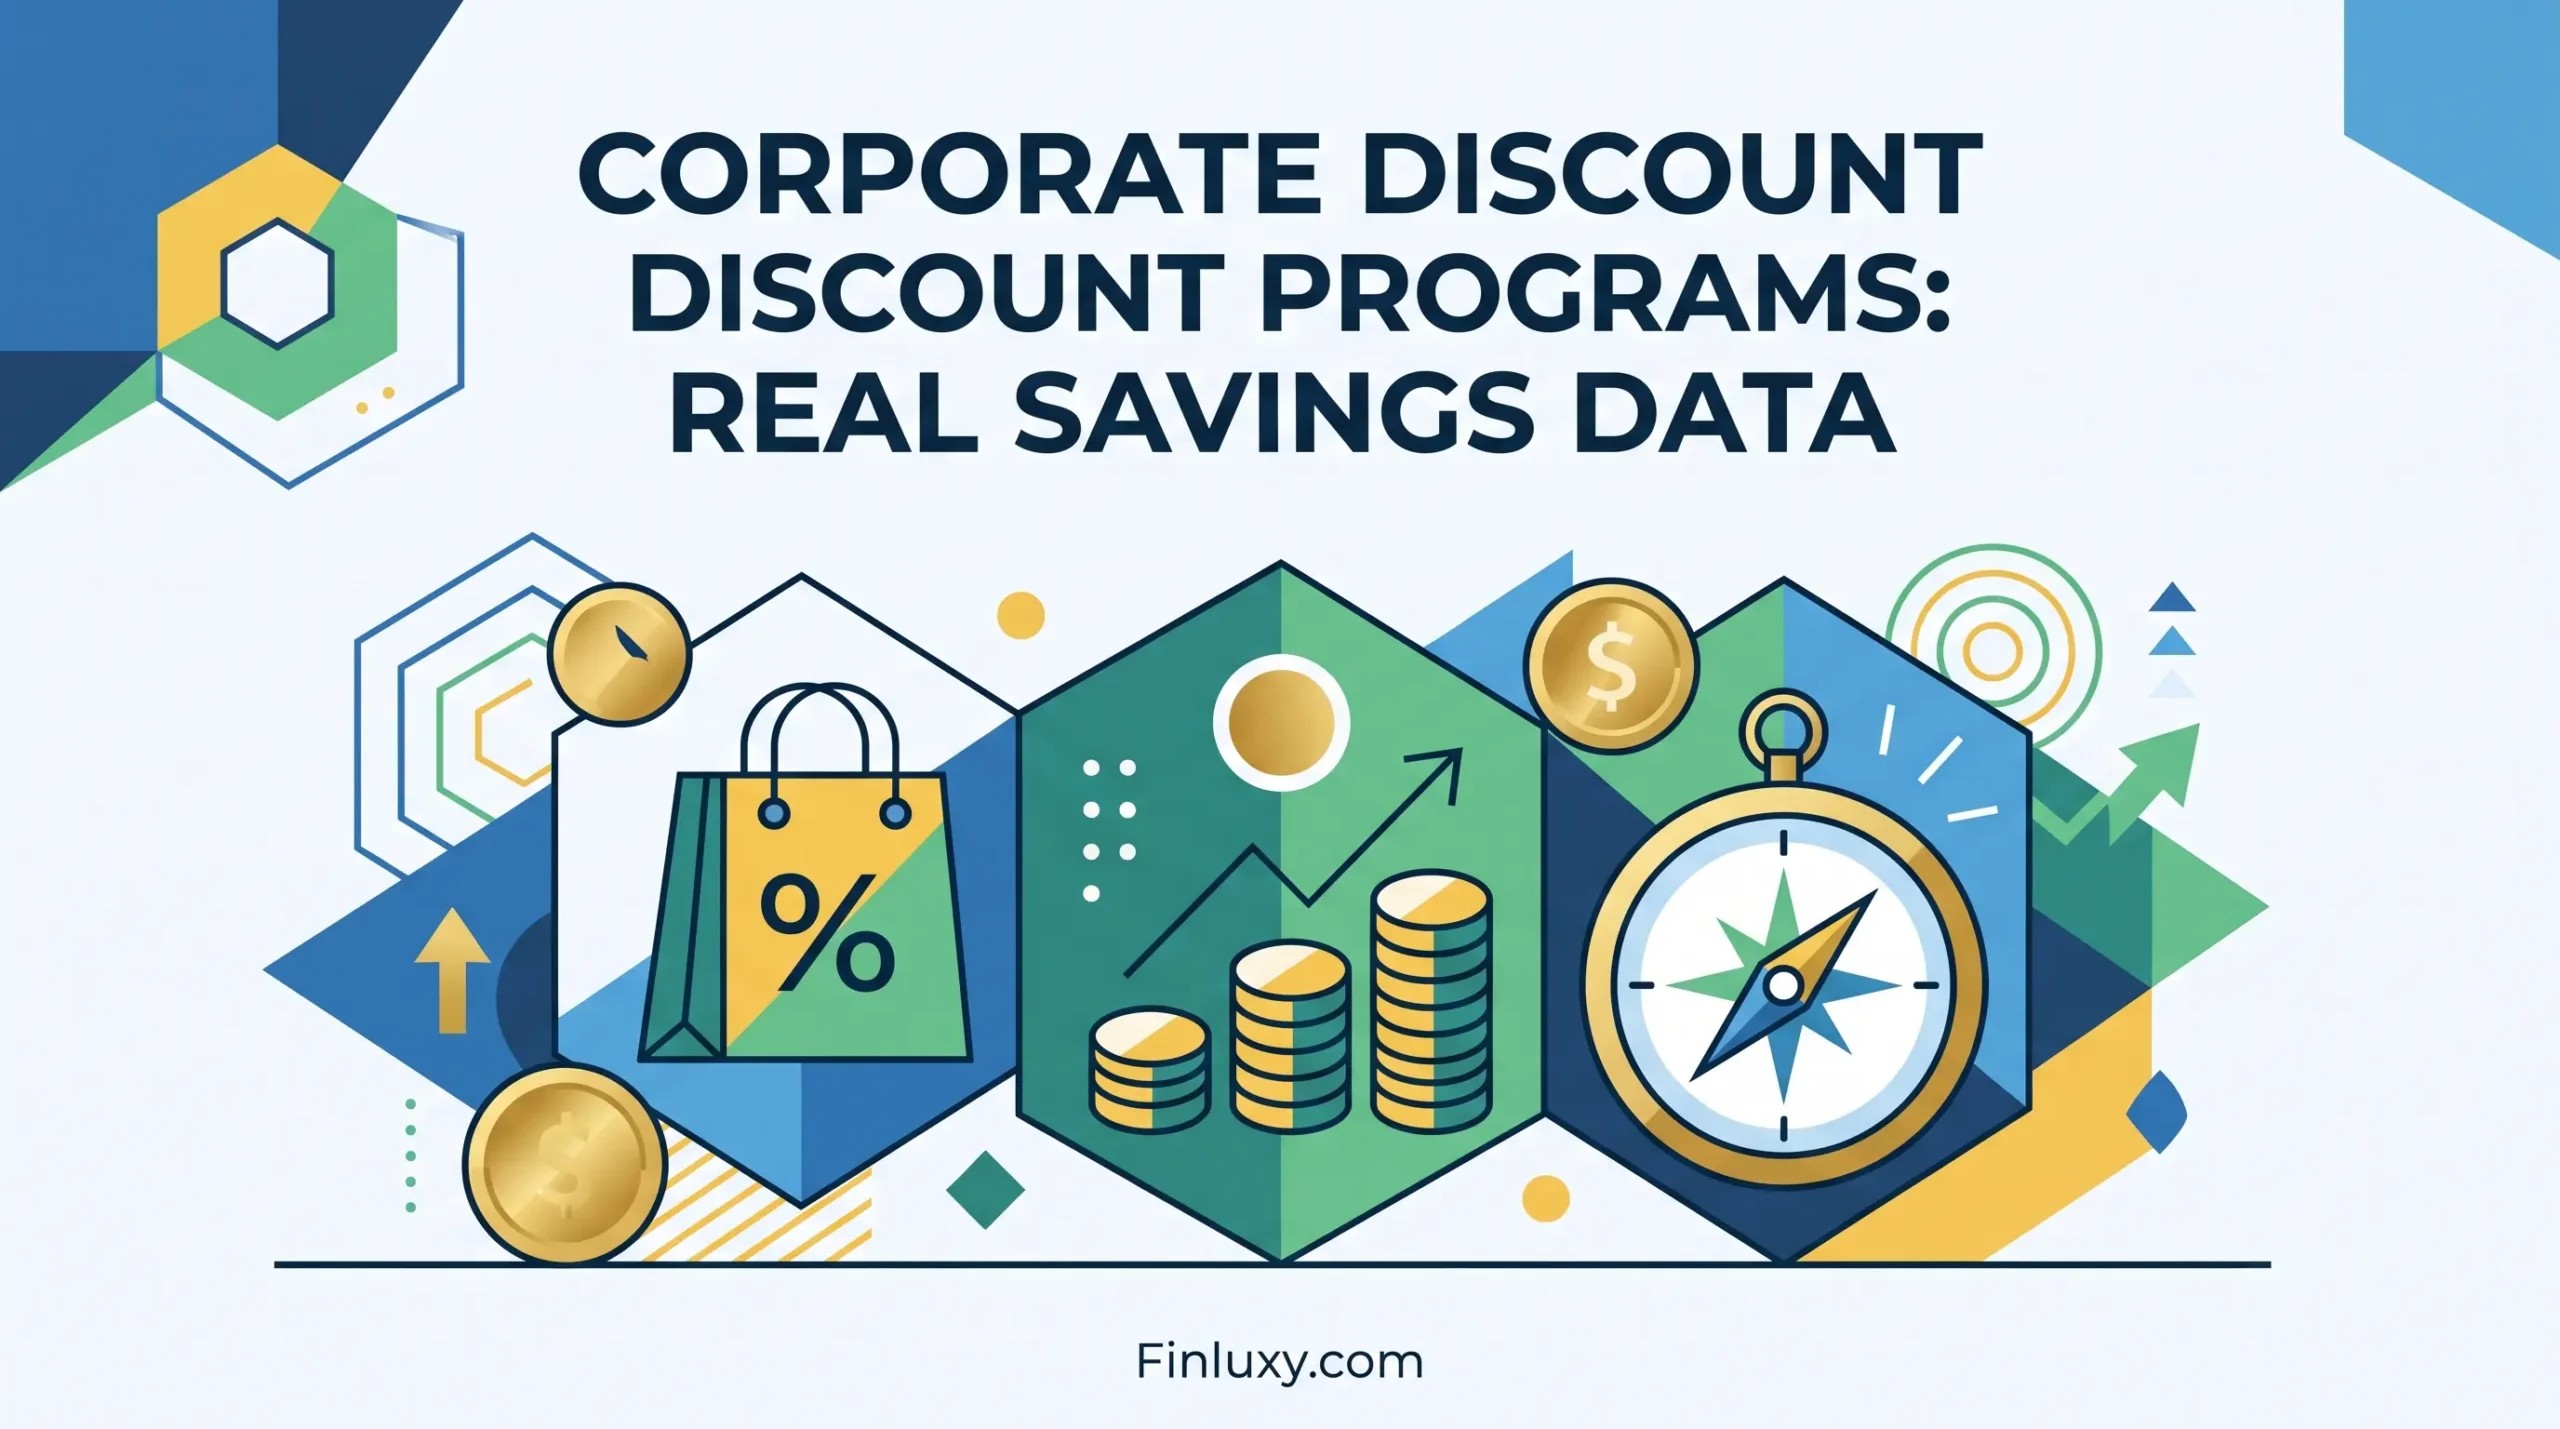
Geometric illustration showing a shopping bag, rising coin stacks, and a compass for corporate savings data.

Corporate Discount Programs: Real Savings Data

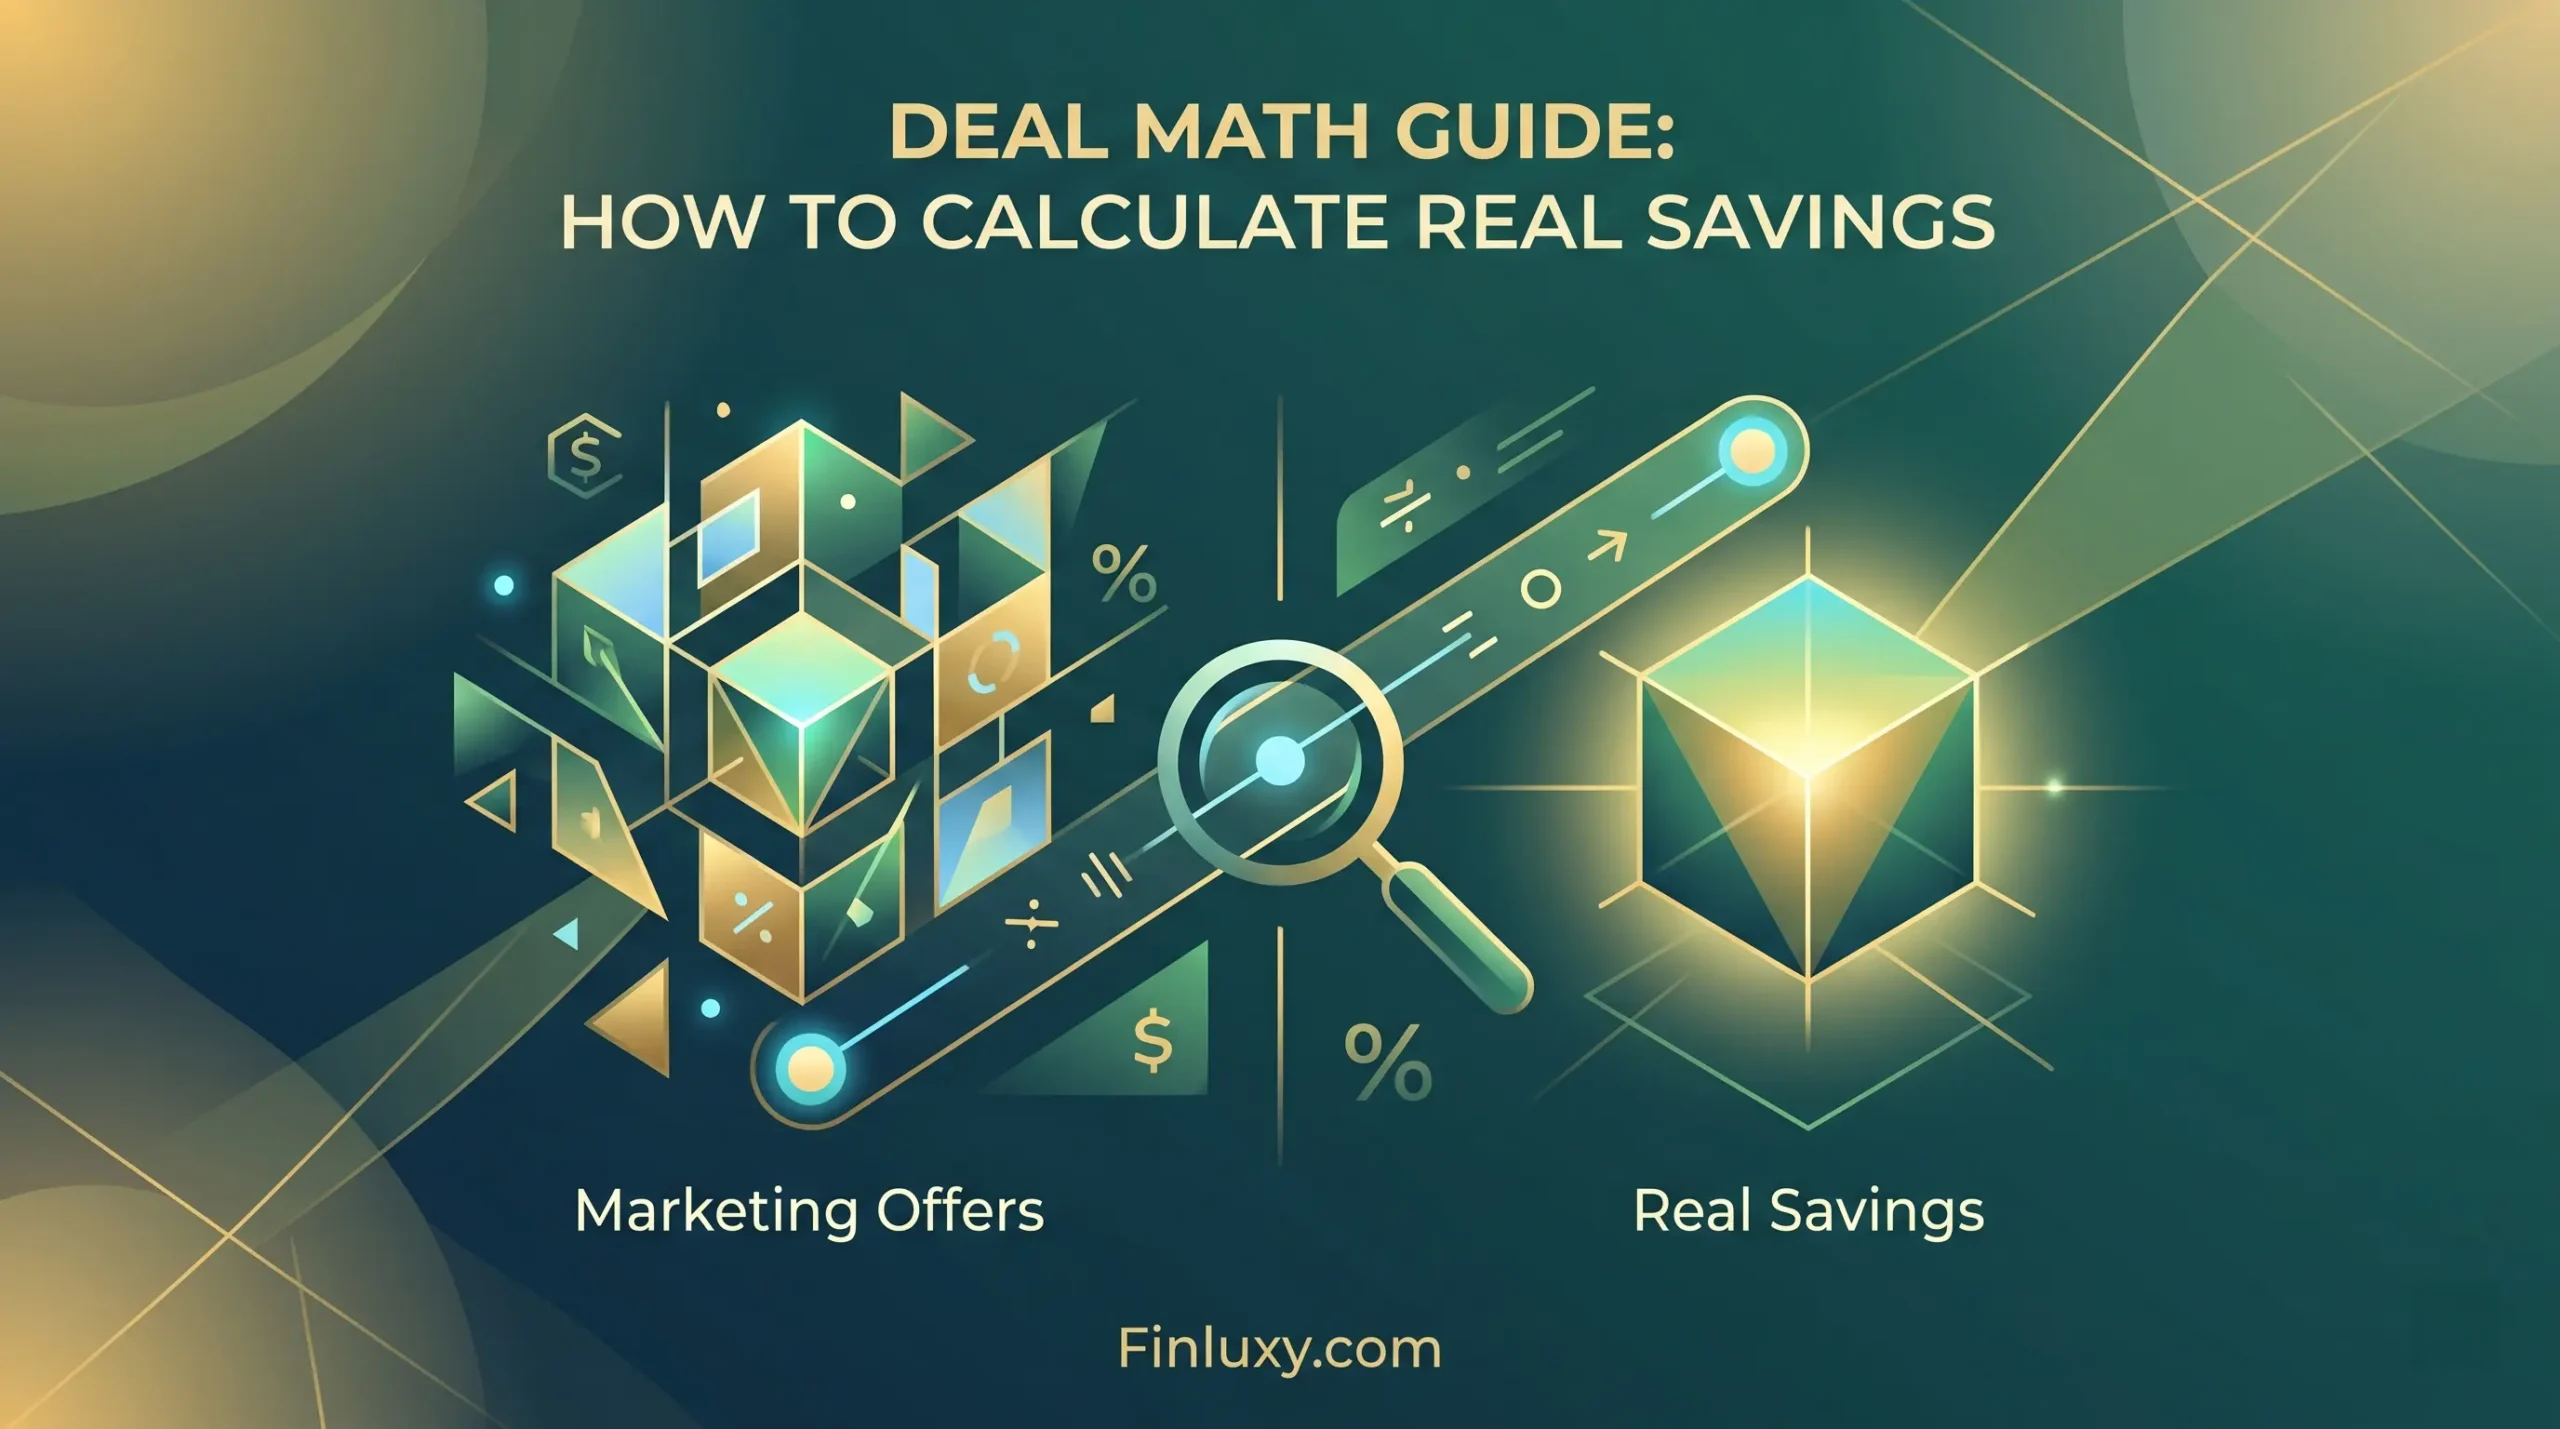
Modern geometric vector illustration comparing dynamic offers against a solid glowing block of real savings. Finluxy.com

Deal Math Guide: How to Calculate Real Savings

A stylized vector illustration of a guest and receptionist at a hotel desk, with the headline "Hotel Rate Negotiation".

Hotel Rate Negotiation: How Much You Can Save

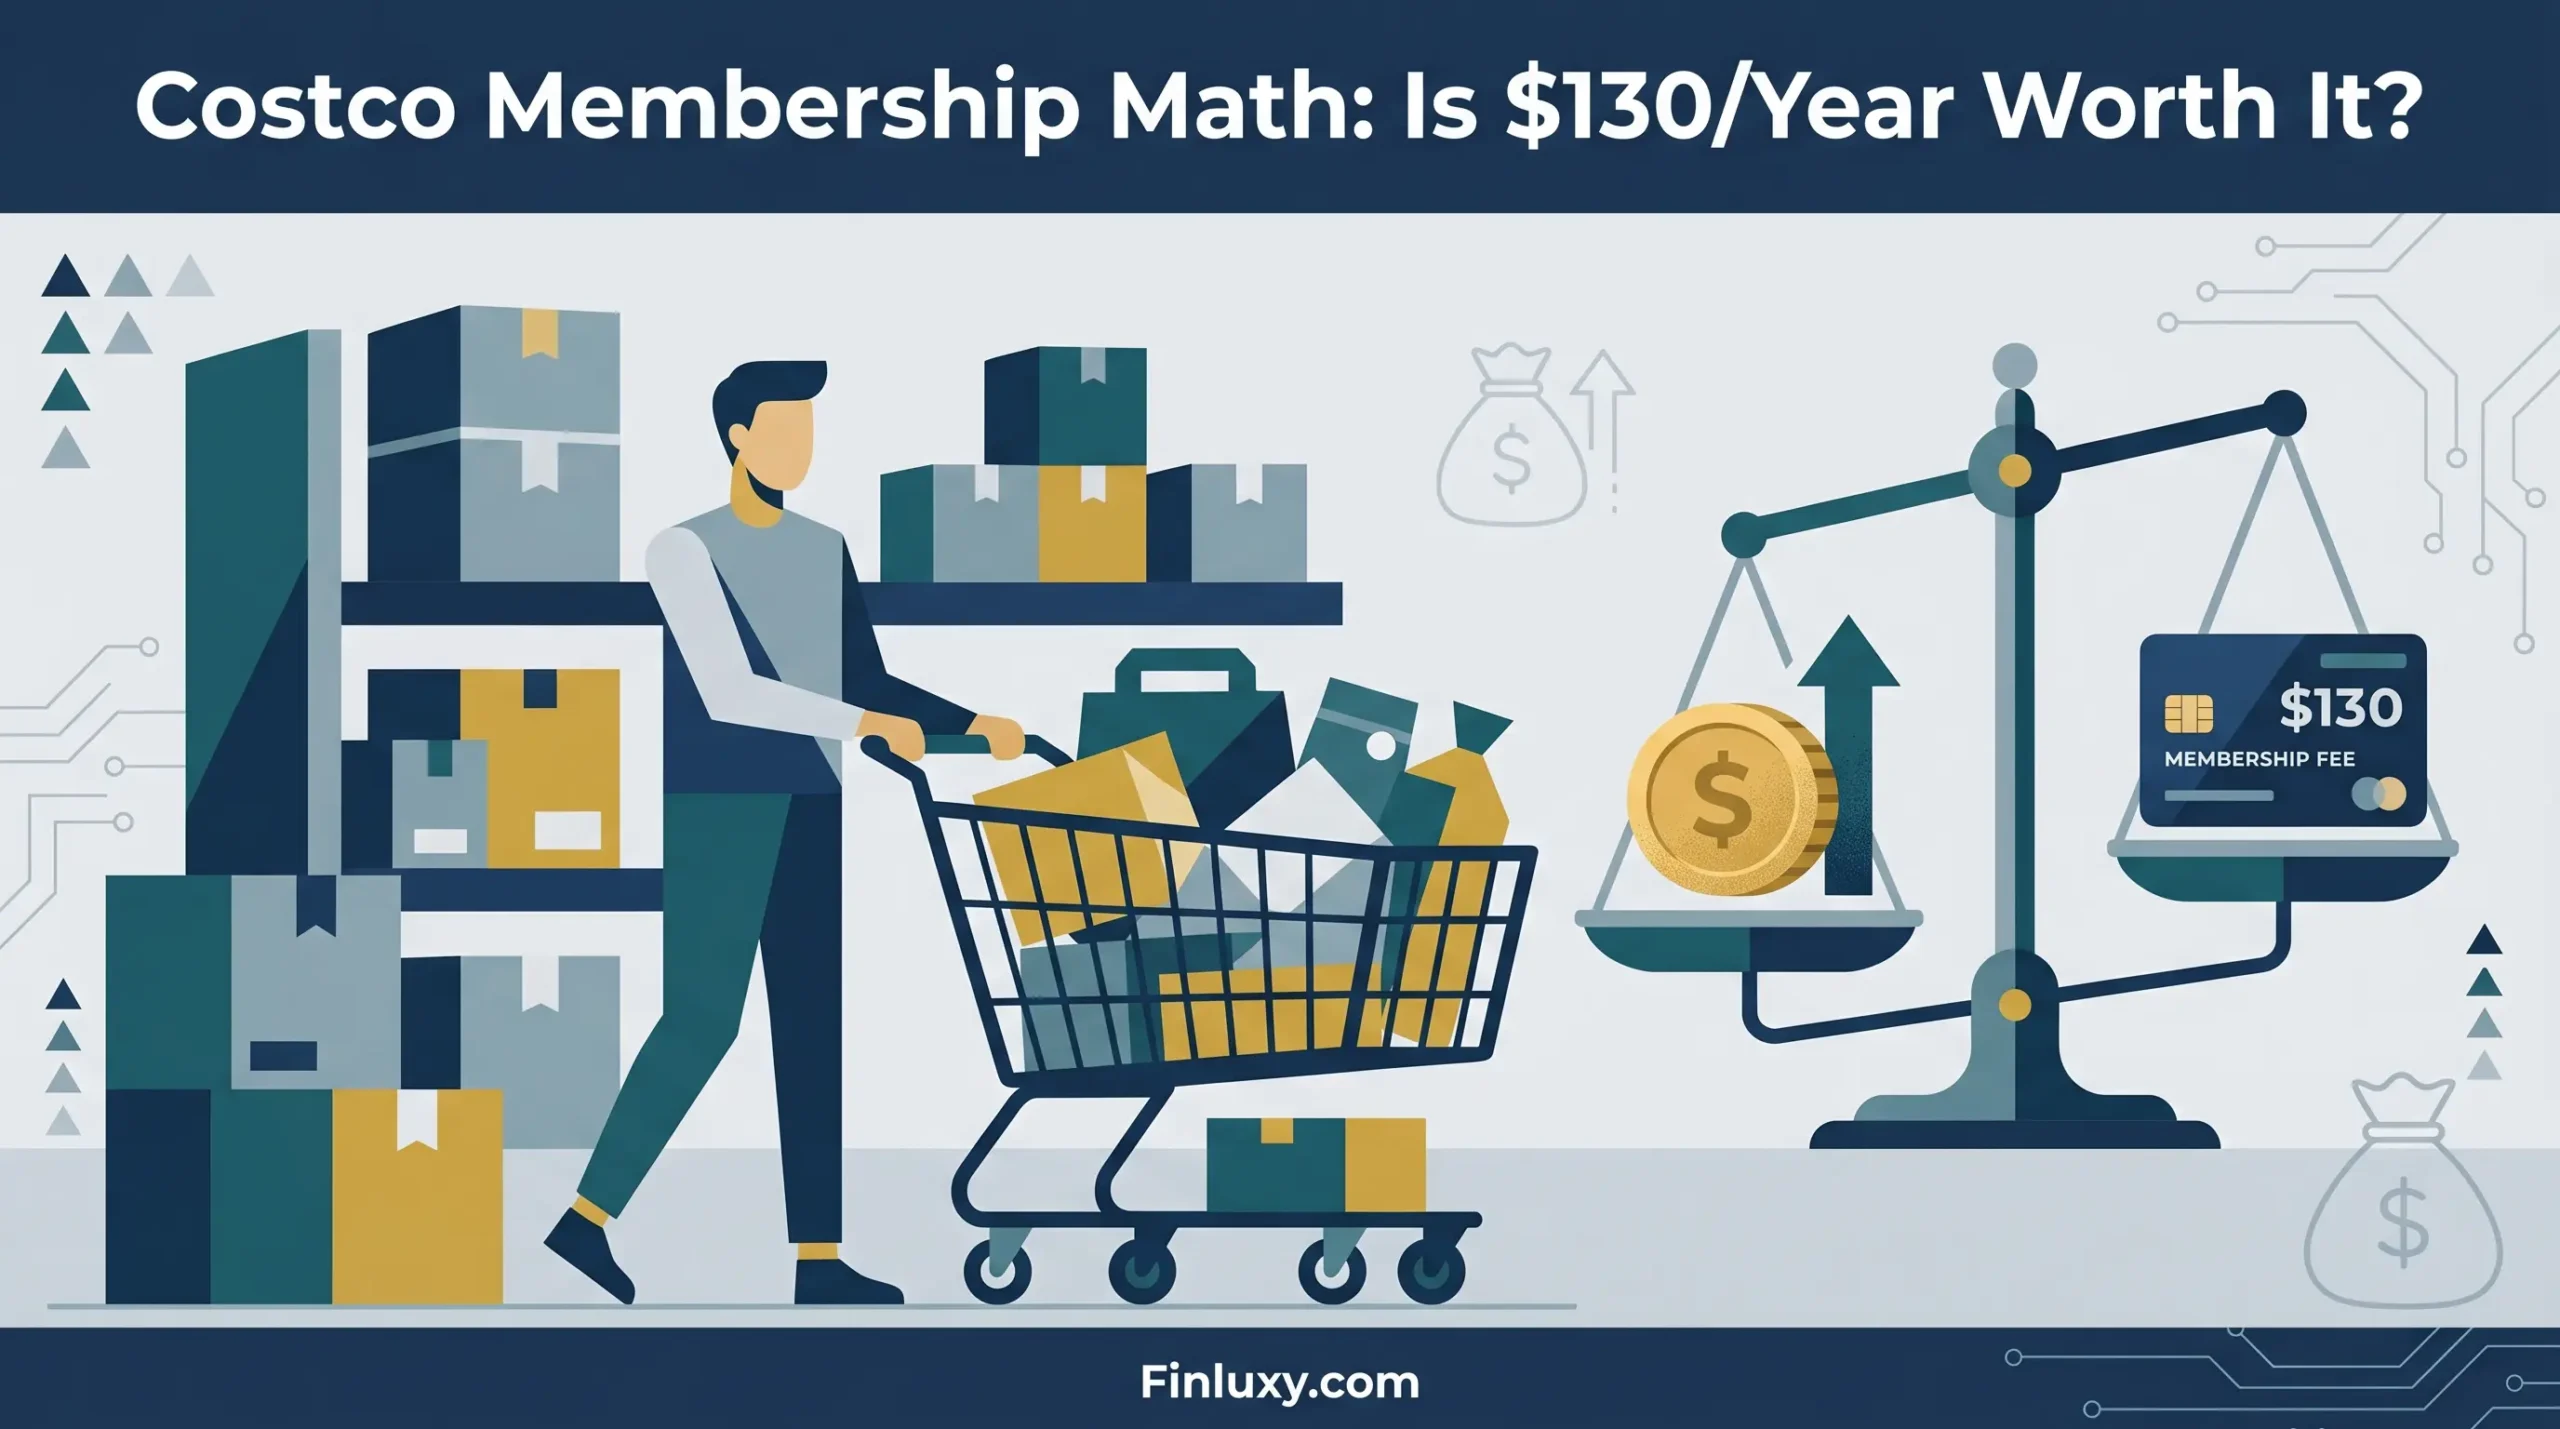
Geometric illustration comparing Costco membership cost on a scale against potential bulk savings with a shopping cart.

Costco Membership Math: Is $130/Year Worth It?

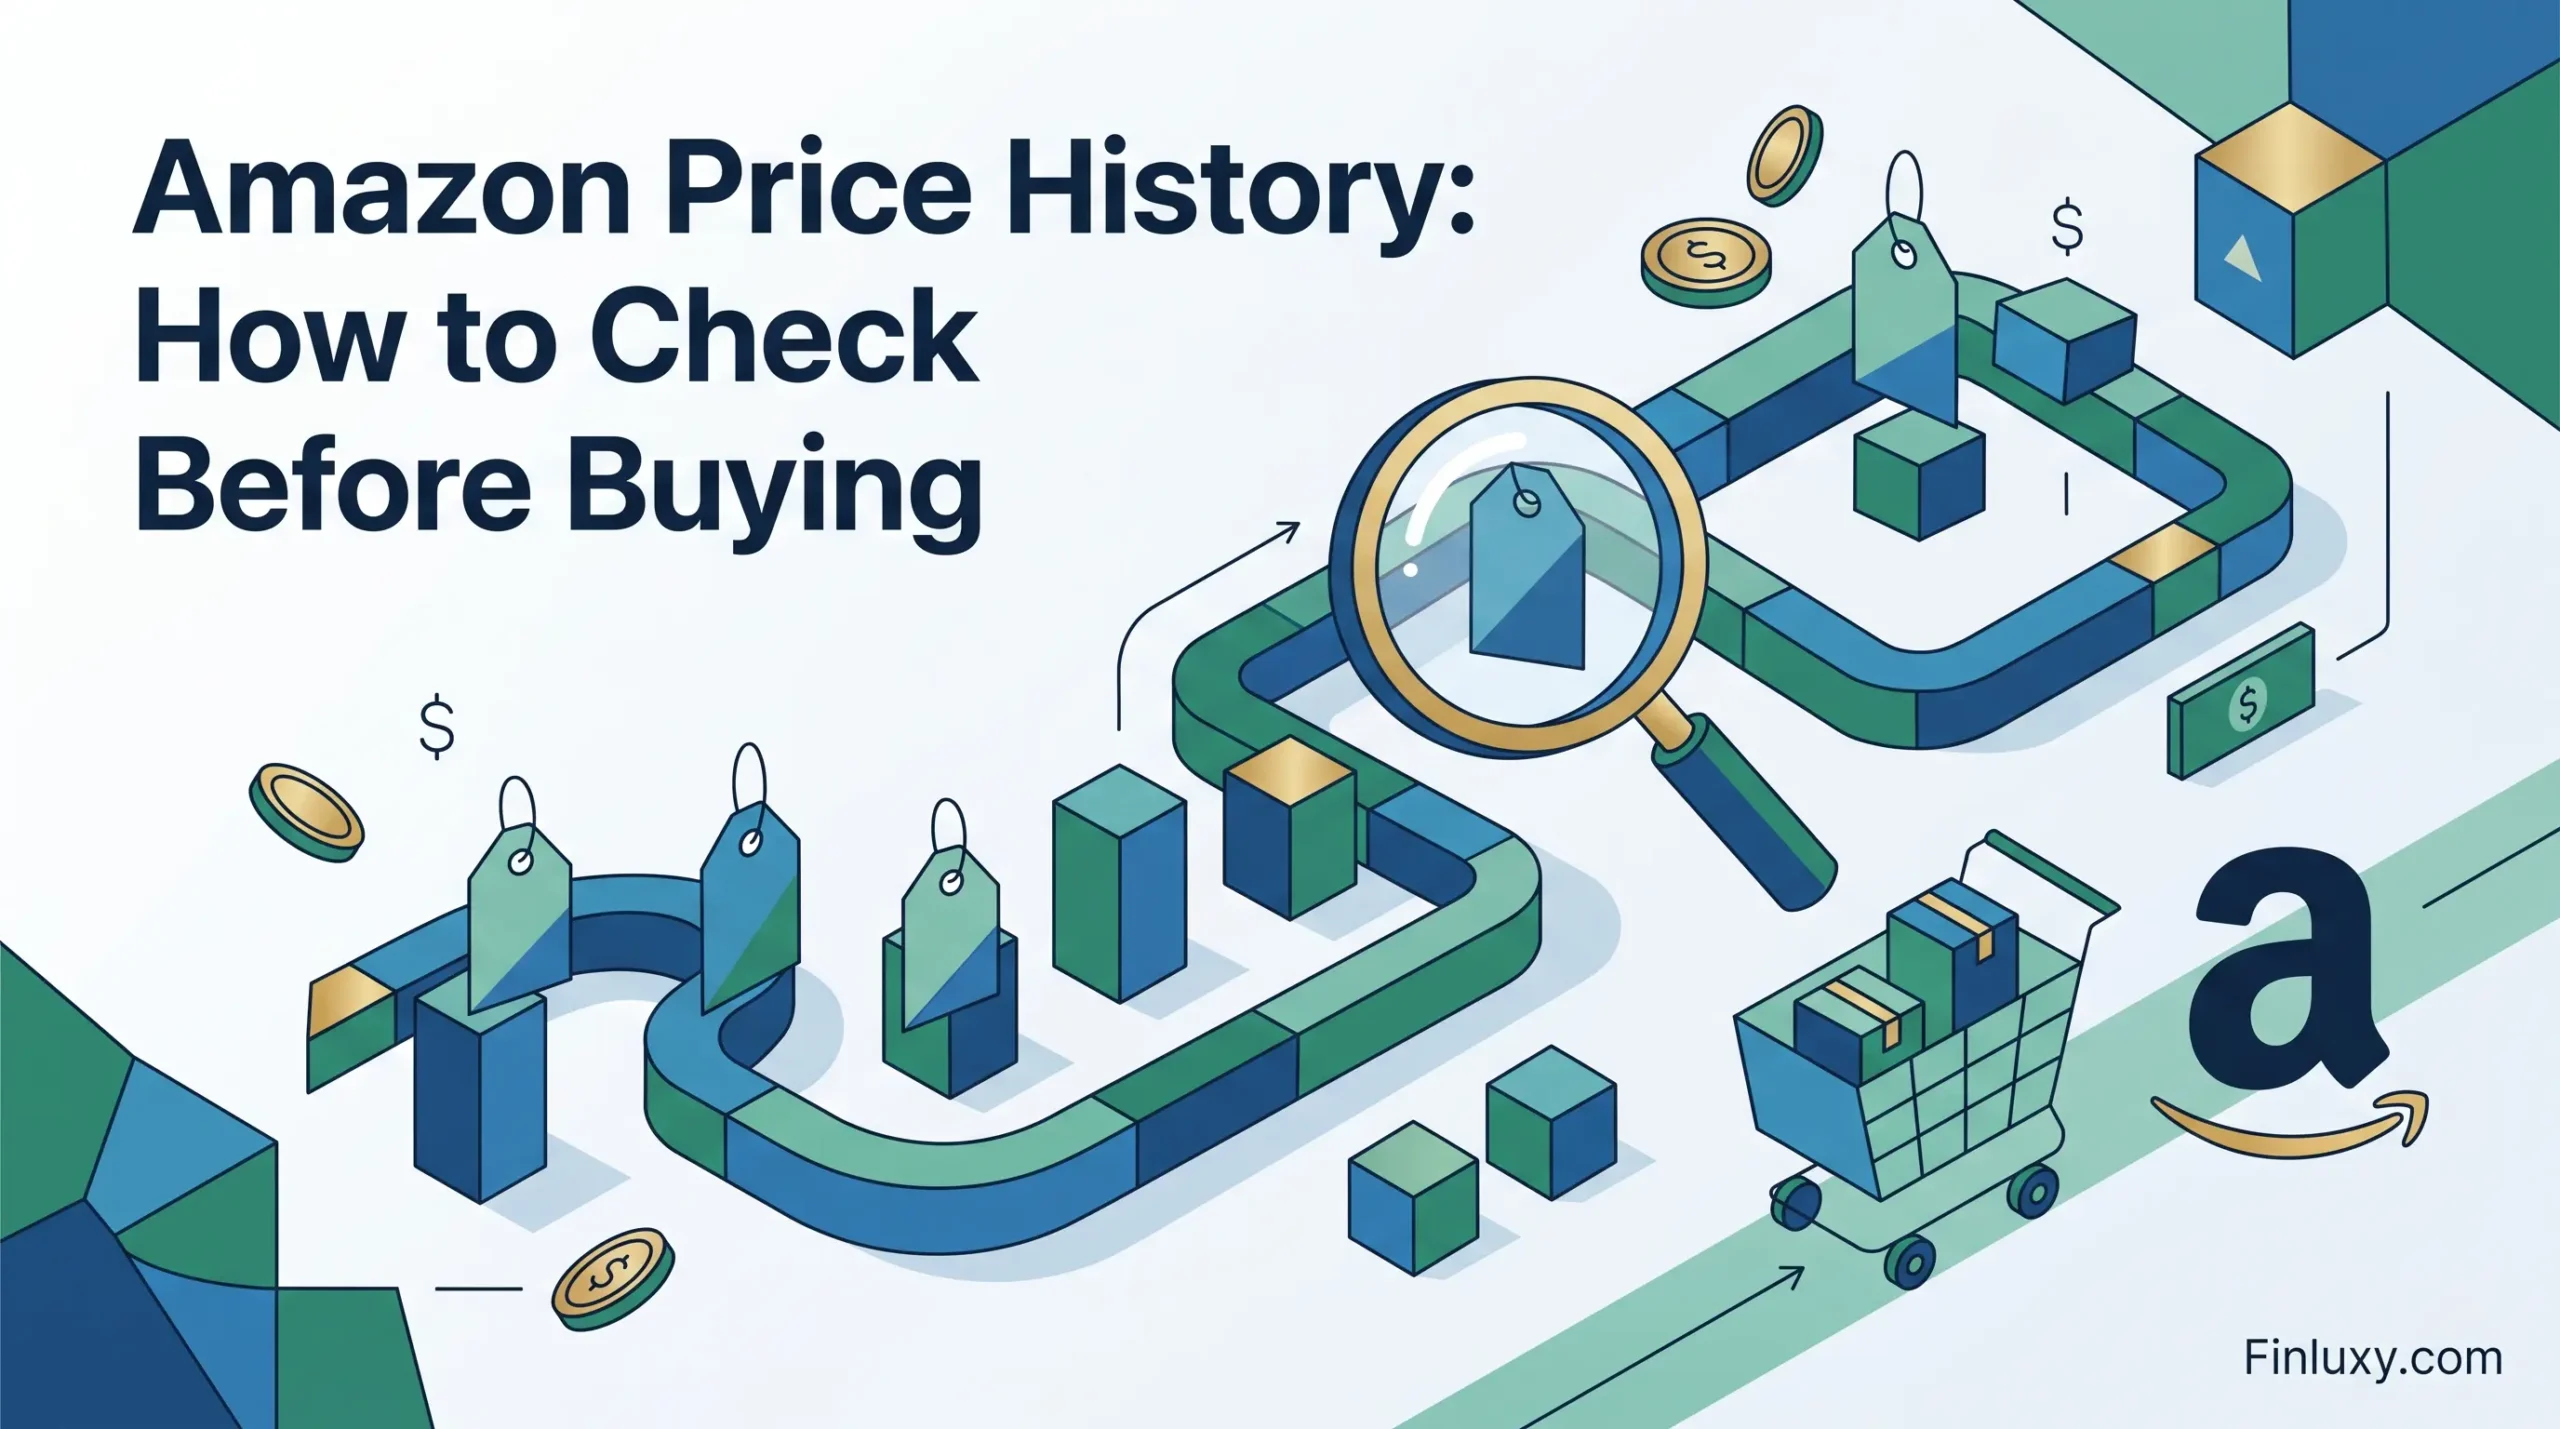
Geometric illustration showing a magnifying glass examining price tags on an isometric path with an Amazon cart.

Amazon Price History: How to Check Before Buying

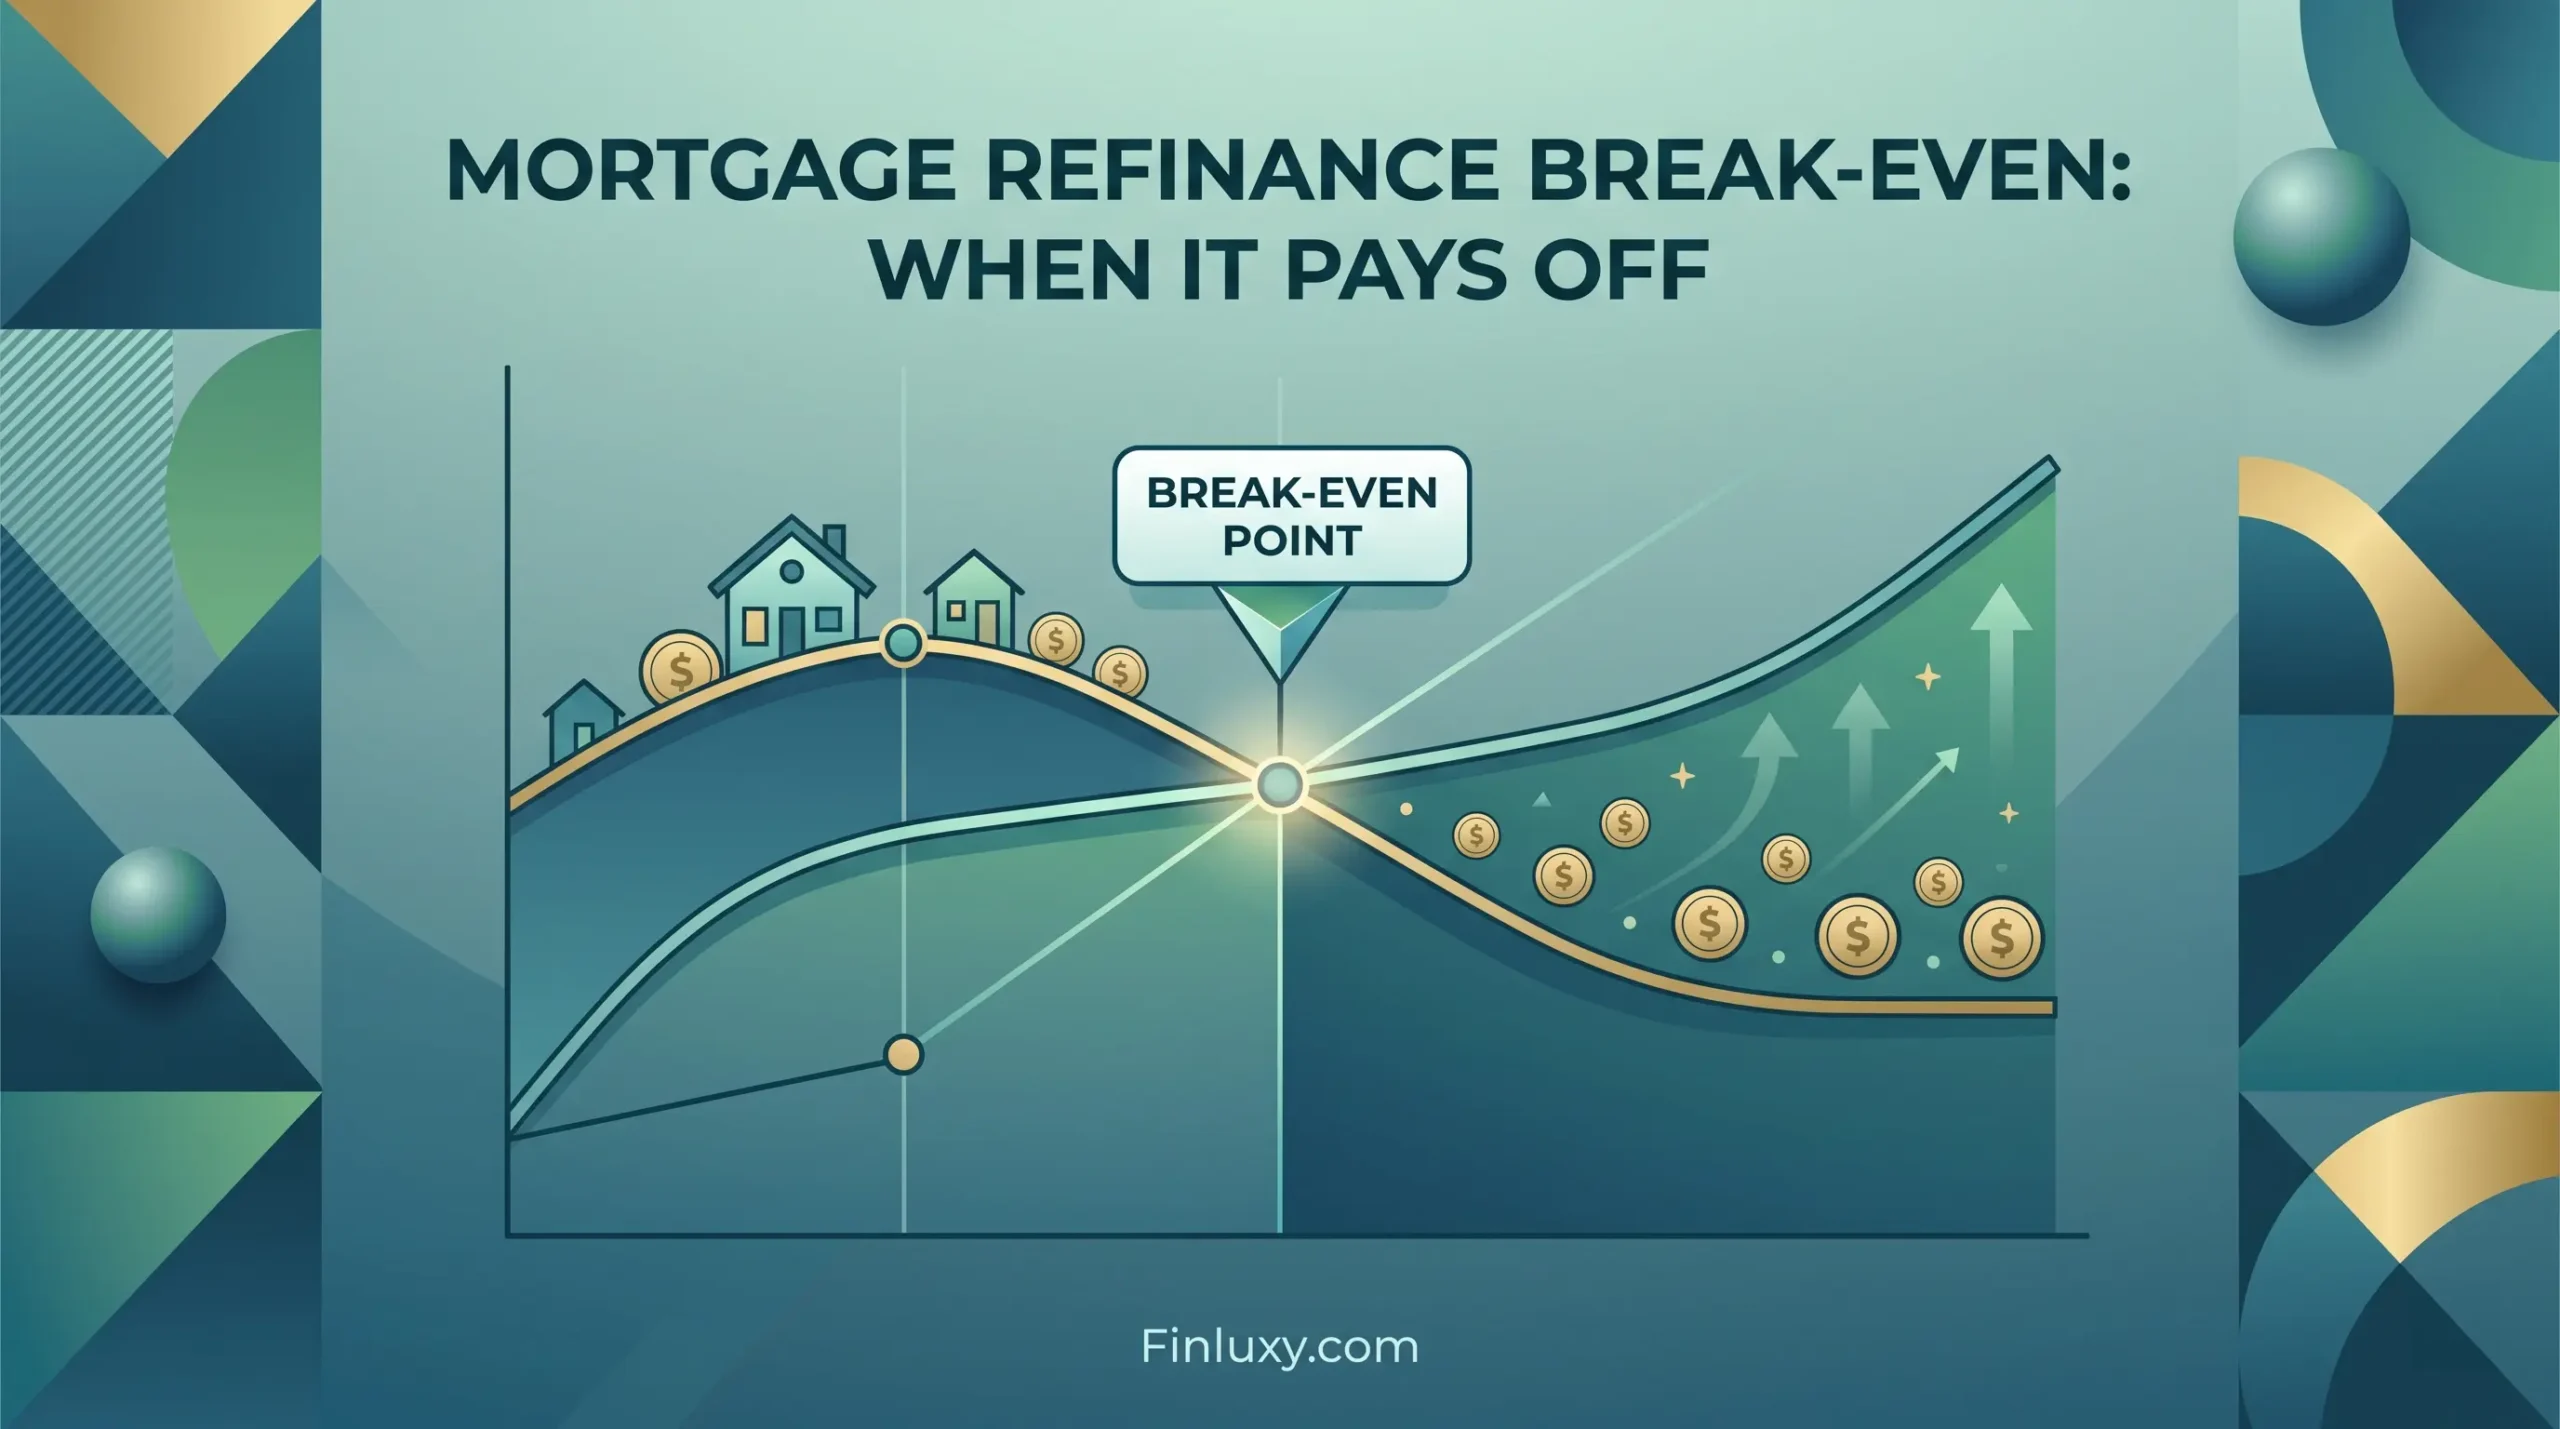
Modern geometric illustration of a finance graph showing a mortgage cost line and a savings line intersecting at a highlighted "Break-Even Point" for mortgage refinancing, leading to an area of profit and growth.

Mortgage Refinance Break-Even: When It Pays Off

An isometric illustration of a large gift box opening to reveal various smaller products and services being decomposed.

Bundle Deal Value: Decomposing What You Actually Get

An infographic titled "Buying Off-Season" showing icons for home goods, technology, clothing, and travel with savings and seasonal charts, for Finluxy.com.

Buying Off-Season: Annual Savings by Category

  • About
  • Privacy Policy
  • Editorial Policy
  • Disclaimer
  • Affiliate Disclosure
  • Terms of Use
  • Contact
© 2026 Finluxy. All Rights Reserved.