 Analysis by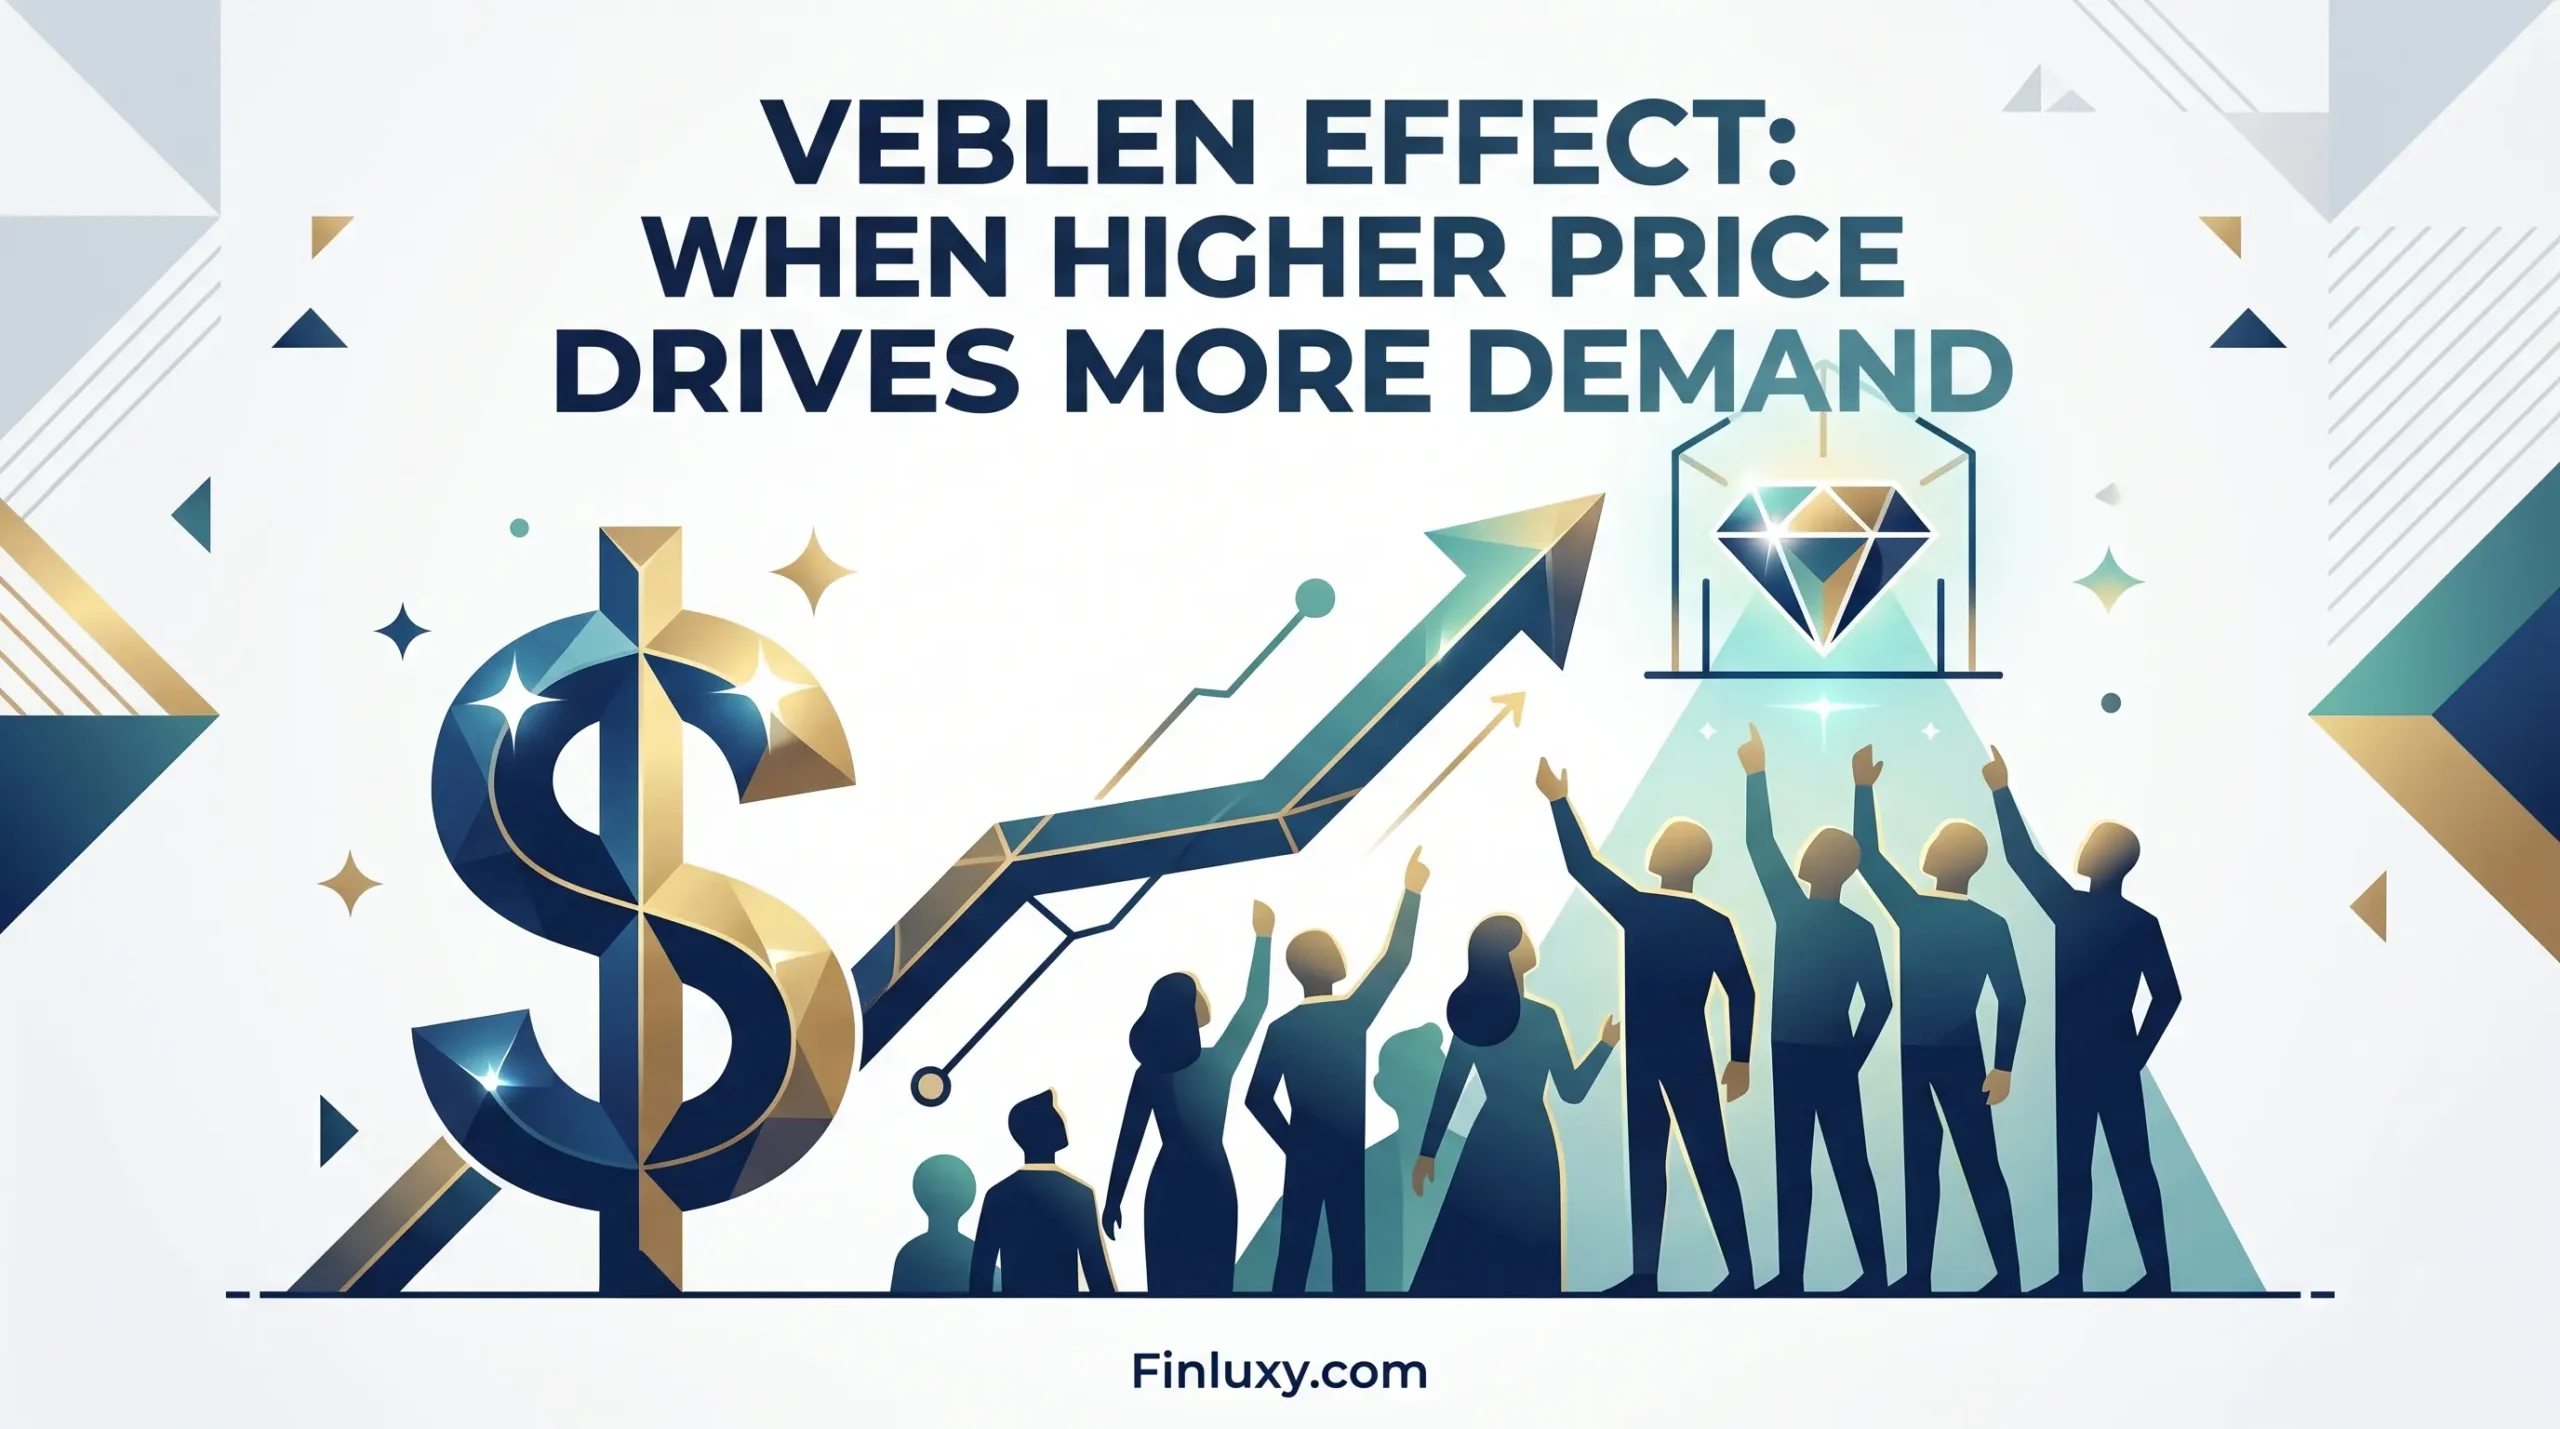
A Land Rover buyer pays roughly $95,000 for a vehicle that J.D. Power’s 2026 U.S. Vehicle Dependability Study scored at 274 problems per 100 vehicles — 70 problems worse than the industry average. A Buick buyer pays roughly $38,000 for a vehicle scored at 160. The more expensive badge delivered measurably lower dependability, and demand for it held anyway. That inversion — price rising while measured quality falls, demand following the price up rather than down — is the Veblen effect, and it is one of the few places in consumer economics where the demand curve bends the wrong way.
Thorstein Veblen described the mechanism in status signaling in luxury pricing terms in 1899: certain goods derive demand not despite their high price but because of it, since the price itself broadcasts the owner’s capacity to absorb it. This is not anchoring, where a high reference number makes a lower one feel reasonable. It is not the decoy effect in product menus, where a deliberately inferior option steers you toward a target. The Veblen effect is rarer and stranger: the price is the product.
Scope: This analysis quantifies the Veblen effect using new-vehicle data as the worked example, because automobiles are the rare luxury category with independent, large-sample quality measurement (J.D. Power) running alongside transparent transaction pricing (Cox Automotive / Kelley Blue Book). Quality scores cited are J.D. Power 2026 U.S. Vehicle Dependability Study figures (released February 2026, covering 2023 model-year vehicles after three years of ownership). Brand-level transaction prices are approximate segment figures drawn from Kelley Blue Book reporting through early 2026 and are presented as ranges, not point quotes for specific configurations. Dependability is one quality dimension — it does not capture performance, materials, or driving experience, which buyers may legitimately value. This is cost-and-value analysis, not financial or purchasing advice.
The key numbers
| Metric | Figure |
|---|---|
| Industry average dependability (2026 VDS) | 204 PP100 |
| Premium-segment average dependability (2026 VDS) | 217 PP100 |
| Mass-market average dependability (2026 VDS) | 200 PP100 |
| Premium vs. mass-market dependability gap | 17 PP100 (premium worse) |
| Industry average transaction price (Jan 2026) | $49,191 |
Sources: J.D. Power 2026 U.S. Vehicle Dependability Study (Feb 2026); Cox Automotive / Kelley Blue Book Average Transaction Price report (Jan 2026). Lower PP100 indicates higher quality.
Read the second and third rows again. J.D. Power found that premium-segment vehicles averaged 217 problems per 100 vehicles in 2026, while mass-market vehicles averaged 200 — the premium gap widening to 17 PP100, with premium brands underperforming mainstream brands in seven of the study’s nine categories. The segment that charges the most measured worst on the one quality dimension subject to independent audit. That is the empirical fingerprint of a Veblen good.
What you are actually paying for above the quality line
Start with the cluster’s standard decomposition: price minus the cost justified by a measurable quality differential equals the psychological premium. When the quality differential is zero or negative, the entire premium is psychological.
Consider the dependability-versus-price relationship across eight brands. Lexus — structurally a Toyota product — posts the best dependability in the entire 2026 study at 151 PP100 while commanding a luxury transaction price, which is why it remains the one premium badge that survives the value test. Below it, the pattern collapses. Porsche scored 182 PP100, marginally better than mass-market Chevrolet’s 178, yet transacts at roughly triple the price. Mercedes-Benz (235) and Audi (244) both scored worse than the industry average of 204 while charging well above it. Land Rover, at 274 PP100, is among the least dependable brands measured — and among the most expensive.
This is where the Veblen effect separates cleanly from the related claim that price merely signals quality. If higher price reliably tracked higher dependability, the premium would be cost-justified information, not a psychological lever. The data shows the opposite correlation in this segment, which means the premium is buying something the dependability study cannot see: the social legibility of the badge itself. Roger Mason’s work on conspicuous consumption and the formal model in Bagwell & Bernheim (1996) both locate the value precisely there — in the price as a visible, hard-to-fake signal of wealth, not in the object’s function.
Finluxy Price-to-Quality Ratio
The cluster’s proprietary metric formalizes the gap. The Finluxy Price-to-Quality Ratio divides a brand’s quality position relative to the category median by its price position relative to the category median. Above 1.0 means better value than the median vehicle; below 0.7 signals a significant price-quality gap. Quality here uses J.D. Power 2026 dependability (converted so that fewer problems scores higher); price uses approximate segment transaction figures against the $49,191 industry median.
| Brand | Dependability (PP100) | Approx. transaction price | Finluxy Price-to-Quality Ratio |
|---|---|---|---|
| Buick | 160 | ~$38,000 | 1.65 |
| Toyota | 185 | ~$40,000 | 1.36 |
| Chevrolet | 178 | ~$42,000 | 1.34 |
| Lexus | 151 | ~$58,000 | 1.15 |
| Audi | 244 | ~$62,000 | 0.66 |
| Mercedes-Benz | 235 | ~$72,000 | 0.59 |
| Porsche | 182 | ~$110,000 | 0.50 |
| Land Rover | 274 | ~$95,000 | 0.39 |
Dependability: J.D. Power 2026 U.S. Vehicle Dependability Study. Prices: approximate segment averages from Kelley Blue Book reporting, early 2026; model-specific configuration pricing was not used, so ratios are directional, not exact for any single trim. Ratio formula: (brand quality ÷ median quality) ÷ (brand price ÷ median price), per Finluxy cluster methodology.
Four mass-market and near-luxury brands clear 1.0. Four luxury brands fall below 0.7 — the threshold the cluster defines as a significant price-quality gap. Land Rover’s 0.39 means a buyer pays roughly 1.9 times the median price for below-median dependability. The ratio is not a verdict on whether anyone should buy these vehicles; it is a measurement of how much of the price is doing work the quality data cannot account for.
Why demand rises with the price
Standard demand curves slope down: raise the price, sell fewer units. Veblen goods invert this within a range, and Bagwell & Bernheim (1996), in Veblen Effects in a Theory of Conspicuous Consumption (American Economic Review, vol. 86), modeled the conditions under which it happens — when buyers use consumption to signal wealth and the signal only works if it is expensive enough to be unaffordable to most. Cut the price and you destroy the signal, which is why a discounted luxury good can lose desirability rather than gain it.
The behavioral economics literature supplies the supporting machinery. Ariely (2008), in Predictably Irrational, demonstrated through his arbitrary-coherence experiments that the “right” price for an object is far more malleable than buyers believe — once a high anchor is set, willingness to pay coheres around it even when the anchor was arbitrary. Kahneman & Tversky (1979) established that the framing of a transaction, not just its economics, drives the decision. The Veblen effect sits on top of these: the high price is simultaneously the anchor, the signal, and the product attribute. None of that requires the buyer to be irrational in the colloquial sense. If social recognition has real value to you — and for status-sensitive purchases it measurably does — paying the premium can be a coherent decision. The question is whether you are paying it knowingly.
The insight most coverage misses
Most writing on Veblen goods treats “you pay more for the same quality” as the punchline. The 2026 dependability data shows something sharper: in the new-vehicle segment, you frequently pay more for lower measured quality. The premium-versus-mass-market gap did not merely fail to favor luxury — it ran 17 PP100 against it, and widened year over year as premium brands loaded in more software-dependent features that generated more faults. The conventional framing assumes a flat quality line with a price premium stacked on top. The actual line, on the dependability axis, slopes the wrong way at the top of the price range. That is a stronger statement than “overpaying,” and it is specific to what independent measurement can verify versus what it cannot. Whatever the luxury premium buys, dependability is not it — and in this dataset, the premium correlates with getting less of it.
What this means for a $150k+ household
At $150k+, the relevant question is rarely whether you can afford the premium — it is whether you are buying the signal deliberately or absorbing it by default. Three distinctions matter. First, separate the verifiable quality differential from the badge: Lexus at a 1.15 ratio is buying you genuine dependability plus status, while Land Rover at 0.39 is almost entirely status with a dependability penalty attached. Both can be defensible if you know which you are doing. Second, recognize where the signal has audience value and where it does not — a vehicle parked in a client’s lot may return social capital that a depreciating asset in a private garage never will, and that asymmetry should change the math. Third, treat the resale interaction seriously: the same below-median dependability that depresses the Price-to-Quality Ratio also drives the repair and depreciation costs you carry for the entire hold period, a recurring drain that the showroom premium understates. The behavioral research is not an argument against ever paying for status; it is an argument for pricing the status line explicitly, the way you would price any other line item, rather than letting an anchor set it for you. A household at this income can afford the Veblen premium — which is exactly why it is worth knowing how much of the check is buying performance you can measure and how much is buying a price tag other people can see.
Is a Veblen good the same as an ordinary luxury good?
No. An ordinary luxury good can still obey the normal demand curve — lower its price and more people buy it. A Veblen good shows rising demand as price rises within a range, because the high price itself is the source of desirability. Bagwell & Bernheim (1996) modeled the specific conditions, tied to wealth signaling, under which a luxury good crosses into Veblen behavior.
How is the Veblen effect different from anchoring?
Anchoring is a comparison effect — a high reference price makes a target price feel reasonable. The Veblen effect is a demand effect — the high absolute price increases how much people want the item. Ariely (2008) showed anchors shape willingness to pay; the Veblen effect goes further, making the price a desirable attribute in its own right rather than just a reference point.
Does a low Finluxy Price-to-Quality Ratio mean I should not buy the item?
Not necessarily. The ratio measures price relative to one verifiable quality dimension — for vehicles, dependability. It deliberately excludes performance, materials, and the social value of the badge, which may be real to you. A ratio below 0.7 tells you the premium is buying something the quality data cannot see, so you can decide whether that something is worth it to you.
Why use vehicles to illustrate a principle that applies to watches and handbags?
Because vehicles are the rare Veblen category with independent, large-sample quality auditing (J.D. Power) running alongside transparent transaction pricing (Cox Automotive). Watches and handbags have no comparable third-party quality measurement, which makes the psychological premium impossible to isolate numerically. The mechanism is identical across categories; vehicles just let you measure it.
Methodology
Quality figures come from the J.D. Power 2026 U.S. Vehicle Dependability Study, a primary source under the cluster’s data hierarchy, measuring owner-reported problems per 100 vehicles after three years of ownership; lower scores indicate higher quality. Transaction pricing comes from Cox Automotive’s Kelley Blue Book Average Transaction Price reporting through early 2026; brand-level prices are approximate segment figures, not configuration-specific quotes, so the Finluxy Price-to-Quality Ratio is reported as directional rather than exact for any single trim. The ratio applies the cluster formula — (brand quality ÷ category median quality) ÷ (brand price ÷ category median price) — with dependability converted so that fewer problems yields a higher quality score, benchmarked against the $49,191 industry median transaction price and 204 PP100 industry median quality. Behavioral framework and demand-curve claims draw on peer-reviewed and foundational sources: Veblen (1899), Kahneman & Tversky (1979), Ariely (2008), and Bagwell & Bernheim (1996). Where brand prices could not be resolved to a verified point figure, ranges were used rather than fabricated precision.
Sources & References
- J.D. Power 2026 U.S. Vehicle Dependability Study — brand and segment PP100 quality scores
- Cox Automotive / Kelley Blue Book — January 2026 Average Transaction Price report
- Kahneman & Tversky (1979), Prospect Theory, Econometrica 47(2): 263–292
- Bagwell & Bernheim (1996), Veblen Effects in a Theory of Conspicuous Consumption, AER 86(3): 349–373
- Ariely (2008), Predictably Irrational — arbitrary coherence and anchoring experiments
- Veblen (1899), The Theory of the Leisure Class — origin of conspicuous consumption