Skip to content
Finluxy
Finluxy
  • Affluent Living
  • Income Reality
  • Life & Money
  • Luxury Spending
  • Real Estate
  • Smart Spending
  • Tax & Wealth

Deductions

Deductions are the primary mechanism through which high earners reduce taxable income — and the deduction landscape changed significantly with the Tax Cuts and Jobs Act of 2017, which took effect for 2018 and fundamentally restructured which deductions are available at what levels. Understanding the current framework is the prerequisite for tax planning that actually reduces what you owe rather than optimizing for deductions that no longer exist in their prior form.

The SALT (state and local tax) deduction cap at $10,000 is the most impactful change for high earners in high-tax states. A California or New York household paying $60,000 in state income and property taxes can only deduct $10,000 federally — a $50,000 reduction in deductibility that, at the 37% marginal rate, represents $18,500 in lost federal tax benefit annually compared to the pre-2017 rules. This cap is set to expire after 2025, making its legislative status worth monitoring.

Mortgage interest deduction is now limited to interest on acquisition debt up to $750,000 (for loans originated after December 15, 2017). A $2 million mortgage generates interest on only $750,000 of principal as deductible — the rest produces non-deductible interest from a federal tax perspective. Charitable deductions remain fully available for cash gifts up to 60% of AGI, and contributions of appreciated securities (directly or via donor-advised fund) generate a deduction at fair market value while avoiding capital gains tax — among the most tax-efficient charitable strategies available.

The qualified business income (QBI) deduction — up to 20% of qualified business income for pass-through businesses — is available to high earners in qualifying industries, subject to income thresholds and business type restrictions. The interaction between QBI and income levels is one of the more complex areas of current tax law. For the full picture of how deductions interact with income tax planning, see income tax. The Tax & Wealth pillar covers the complete set of strategies for reducing tax liability legally and effectively.


Geometric vector illustration for Finluxy shows a couple near a home with solar panels, wind turbines, and money symbols.

Energy Credits for Middle-Income Homeowners: Real Value

Geometric illustration showing icons for EV charging, solar panels, and home energy upgrades, representing tax credit opportunities.

Energy Tax Credits: EV, Solar, and Home Upgrades

Geometric illustration of a house, coins, and a minus sign showing mortgage tax savings value with Finluxy.com logo.

Mortgage Interest Deduction: Real Dollar Value

An isometric geometric illustration of a student navigating financial steps toward a tax deduction.

Student Loan Interest Deduction: Who Qualifies at $80k–$130k

A modern geometric vector illustration with medical and financial icons, a 7.5% divider, and the headline "Medical Expense Deduction: 7.5% AGI Threshold". Finluxy.com is at the bottom.

Medical Expense Deduction: 7.5% AGI Threshold

A geometric vector illustration for Finluxy.com showing a parent and child next to flowing money and a bank icon, with the text "Child Tax Credit at $80k–$130k".

Child Tax Credit at $80k–$130k: What You Actually Get

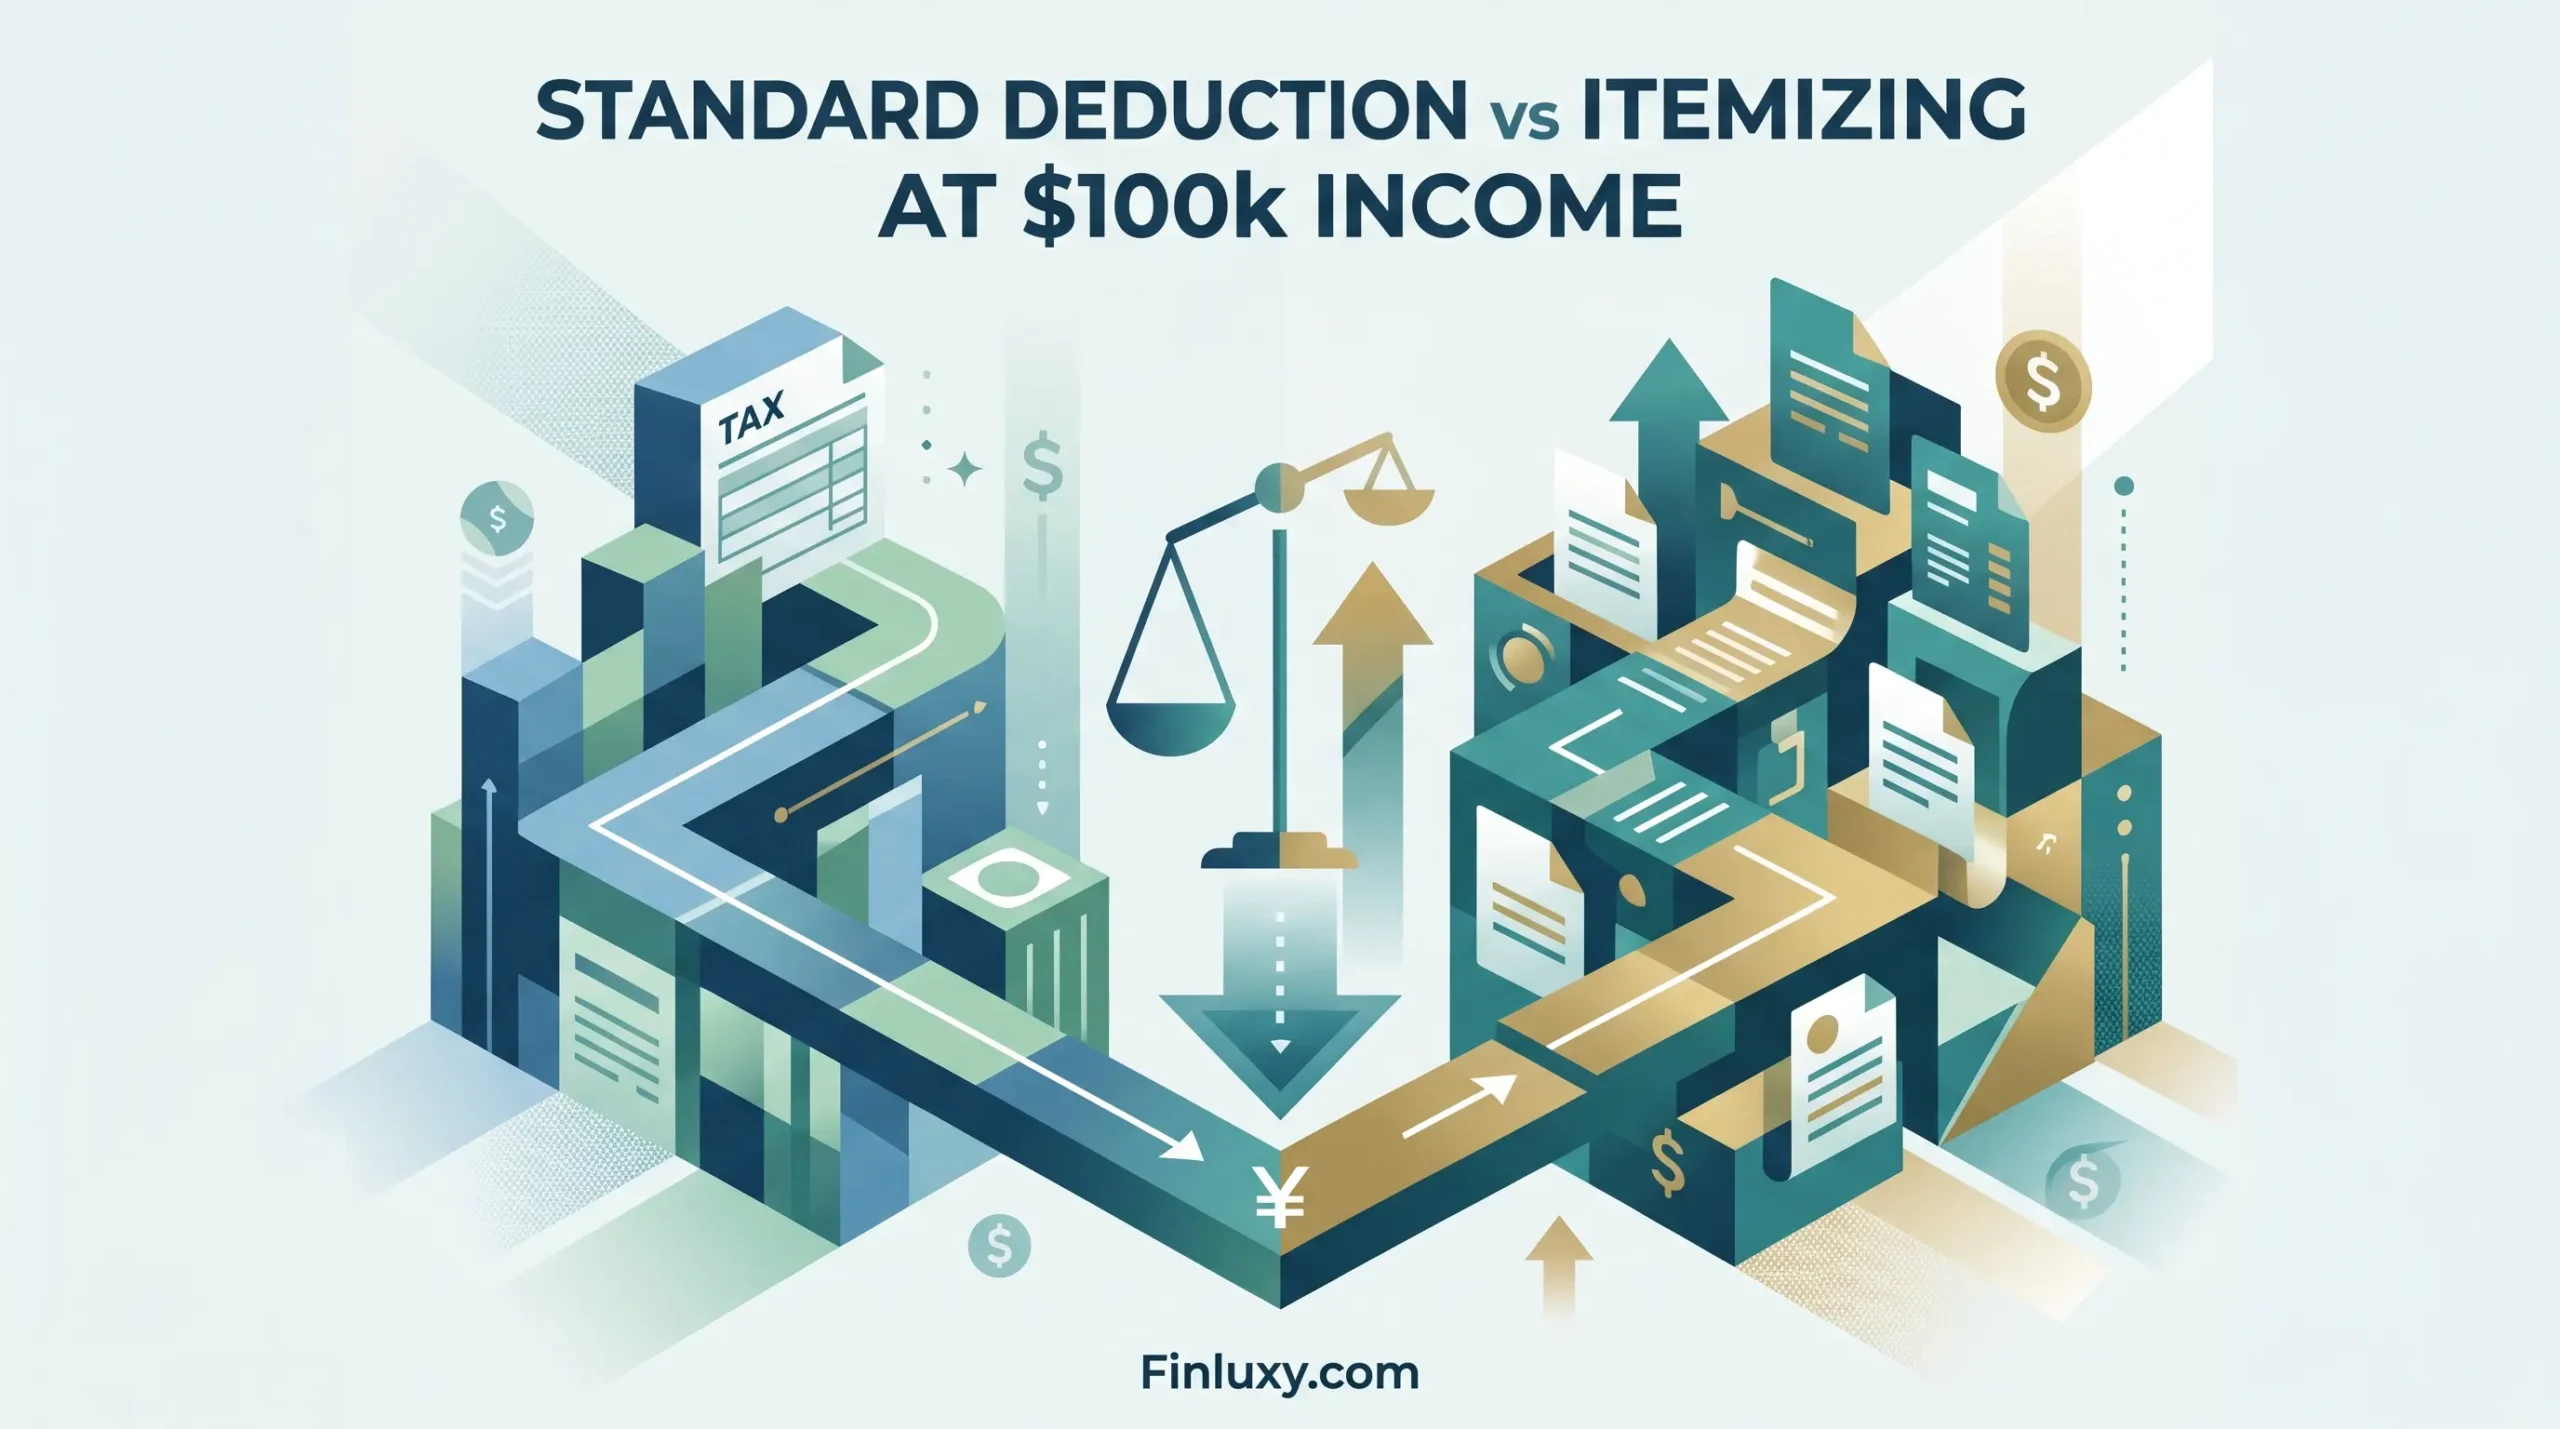
Geometric illustration weighing standard deduction versus itemizing for a 100k income, for Finluxy.com.

Standard Deduction vs Itemizing at $100k Income

A vector illustration with a diagram showing how business deductions reduce the tax burden for a self-employed professional working at a desk.

Business Deductions for Self-Employed Professionals

A modern geometric illustration showing a family and financial advisors managing household deductions, including mortgage interest and charitable giving, titled 'Tax Deduction Guide for $150k+ Households' at Finluxy.com.

Tax Deduction Guide for $150k+ Households

Geometric illustration showing a stylized professional navigating dissolving tax concepts like moving expenses, business costs, and casualty losses.

Deductions Eliminated by TCJA: What You Lost

Modern geometric illustration showing a $10k cap block weighing down on stylized people, representing tax impact.

SALT Cap Impact: Who Loses the Most at $10k Limit

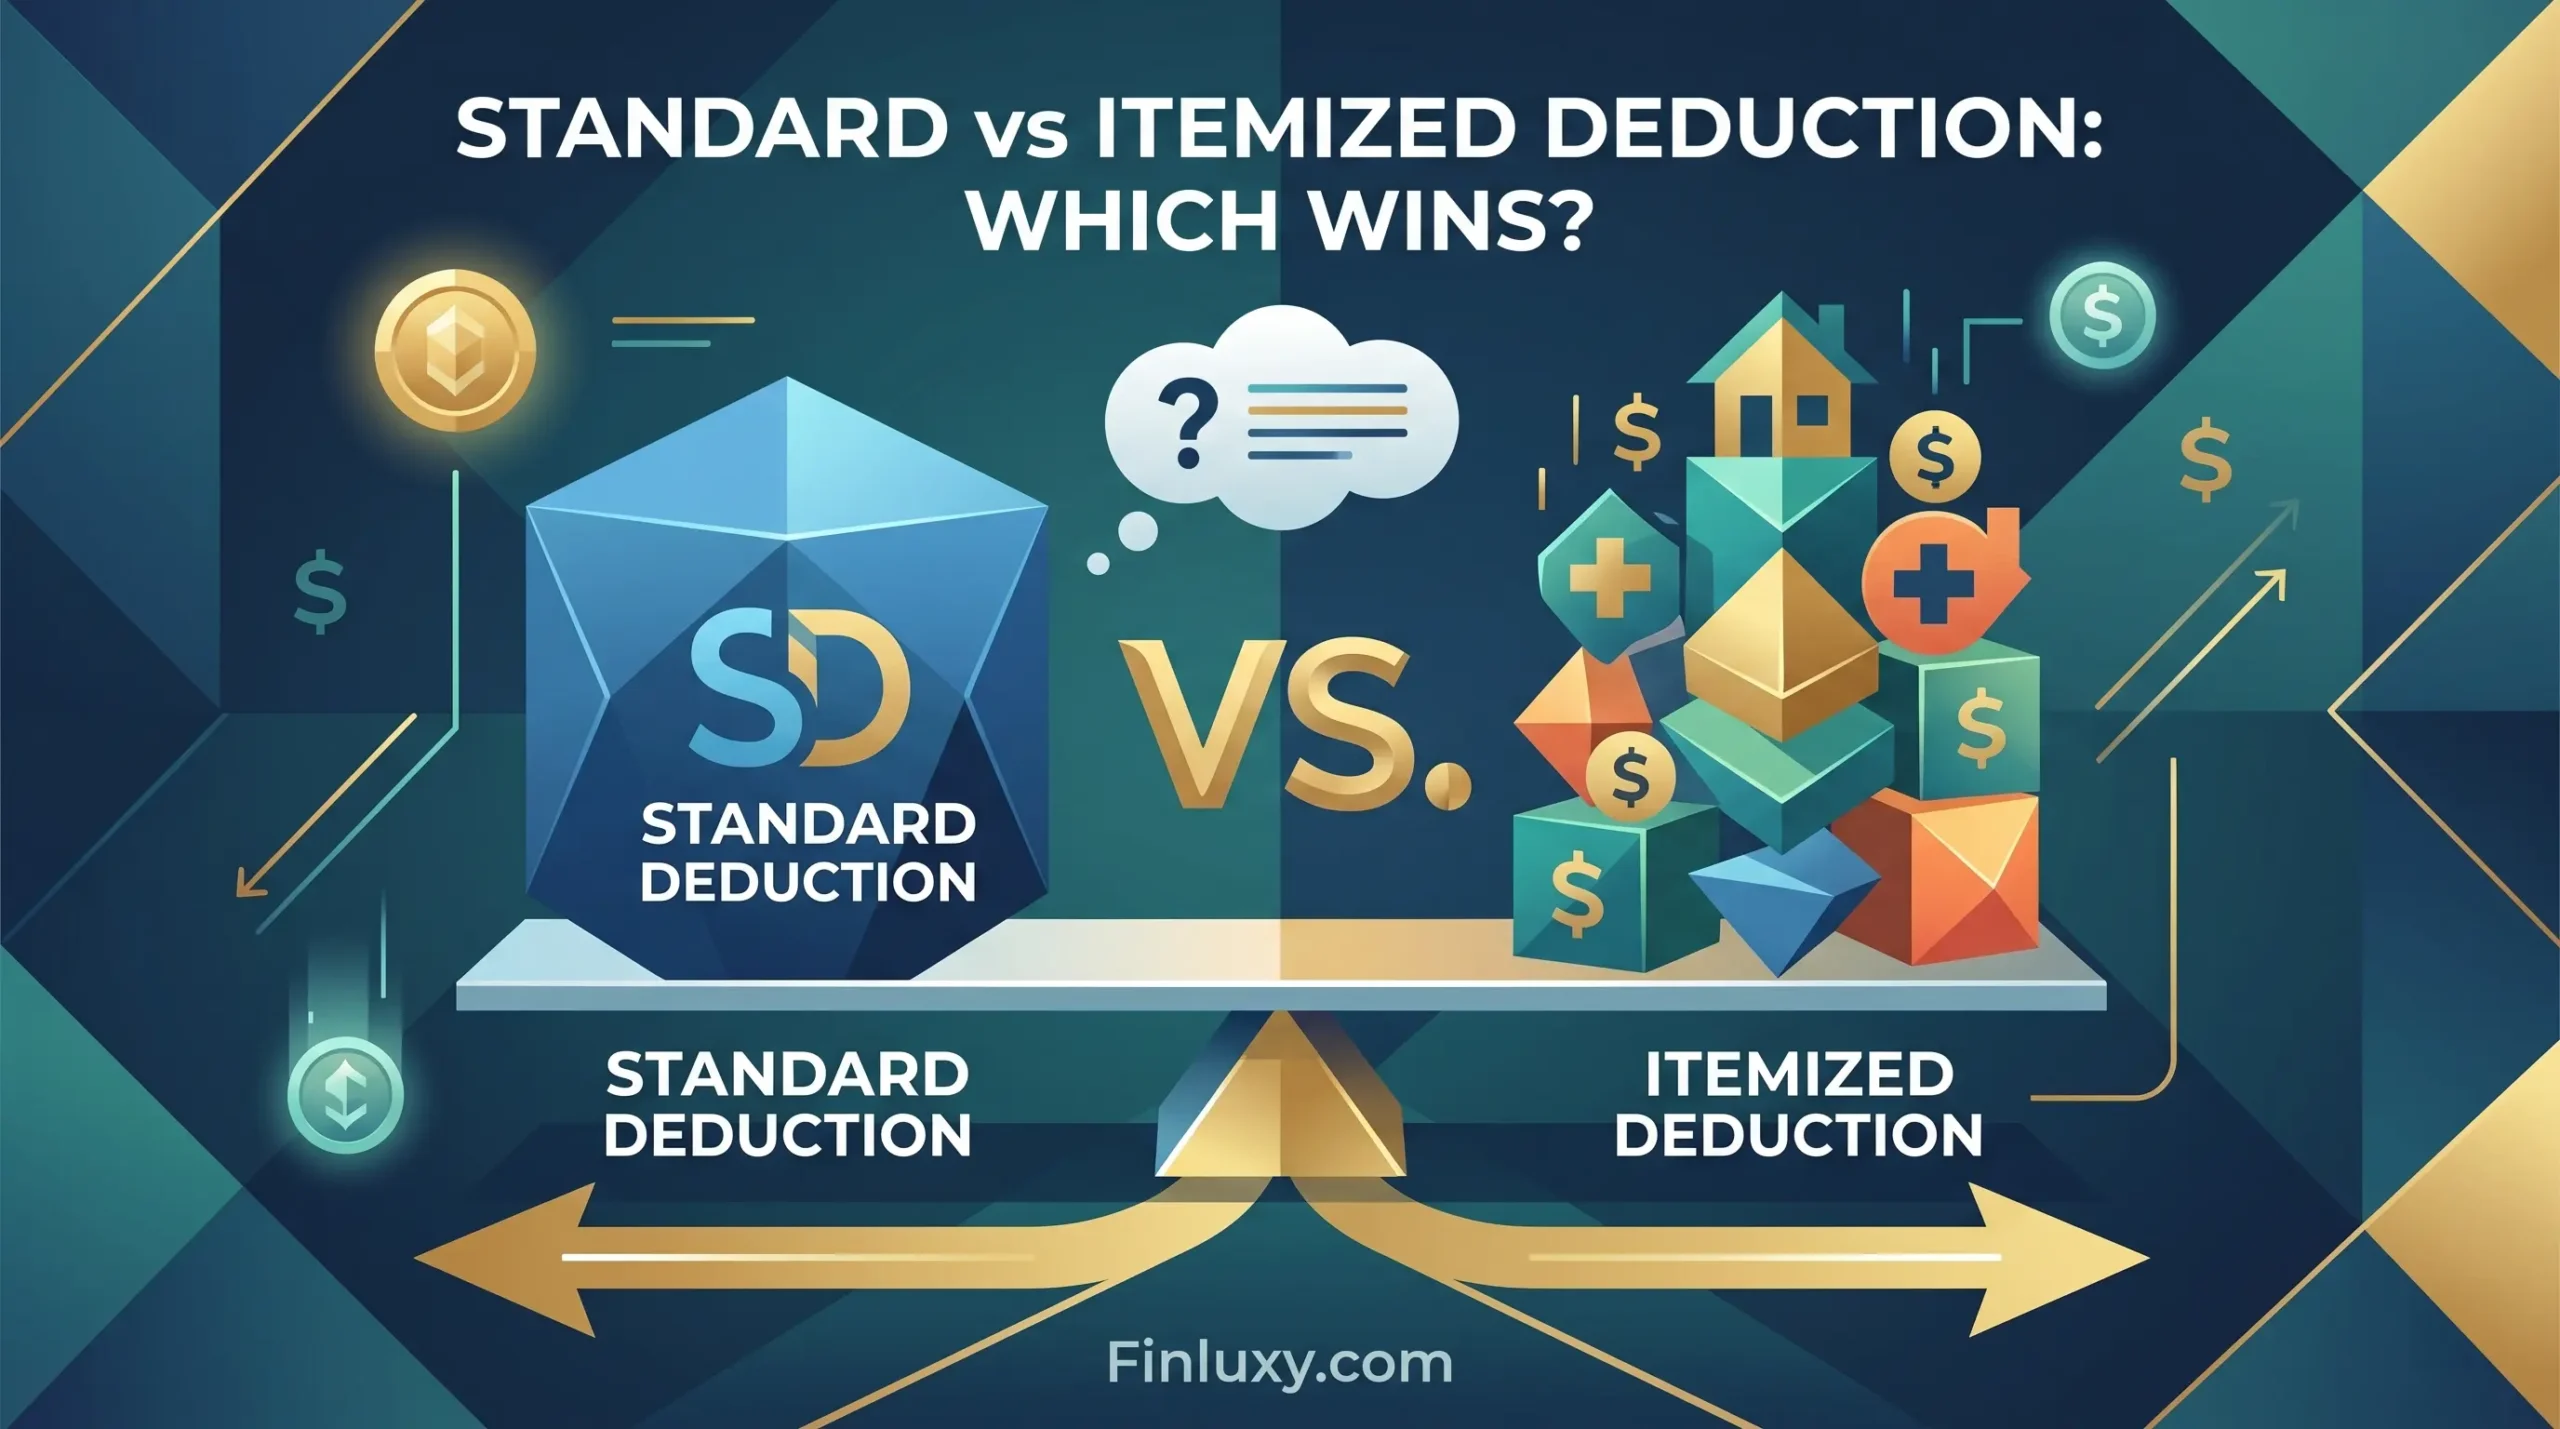
A geometric vector illustration on a blue and green gradient background. It shows a visual comparison between 'Standard Deduction' and 'Itemized Deduction' represented as two differing sides of a digital scale. The top headline reads, "STANDARD vs ITEMIZED DEDUCTION: WHICH WINS?". The left side features a clean, single polygonal shape for Standard, and the right side features an intricate stack of various shapes with symbols for Itemized, including housing and health icons, all under a 'VS.' graphic and a thought bubble with a question mark. Small gold and green coins float around the scale. At the bottom, a white and gold arrow points left and right with 'Finluxy.com' in the center. The composition is clean, modern, and vector-style.

Standard vs Itemized Deduction: Which Wins?

Geometric illustration of a thinking graduate with a tax form and coins, exploring student loan deduction.

Student Loan Interest Deduction: Who Can Use It

Modern geometric illustration showing how above-the-line tax deductions directly reduce adjusted gross income, featuring subtle financial elements.

Above-the-Line Deductions That Reduce AGI Directly

Modern geometric illustration of a person balancing charitable giving icons and tax calculation elements on a scale.

Charitable Deduction Math at 37% Bracket

Flat geometric illustration of a man working on a laptop within a house frame, surrounded by money and question marks.

Home Office Deduction: Who Qualifies and How Much

  • About
  • Privacy Policy
  • Editorial Policy
  • Disclaimer
  • Affiliate Disclosure
  • Terms of Use
  • Contact
© 2026 Finluxy. All Rights Reserved.