Skip to content
Finluxy
Finluxy
  • Affluent Living
  • Income Reality
  • Life & Money
  • Luxury Spending
  • Real Estate
  • Smart Spending
  • Tax & Wealth

Car Depreciation

Depreciation is the cost of car ownership that never appears on an invoice — which is precisely why it’s so often underweighted in purchase decisions. For most luxury vehicles, it is also the largest single cost of ownership over a five-year holding period, exceeding financing, insurance, and maintenance combined. Understanding the depreciation curve before you buy is one of the highest-value financial decisions a car buyer can make.

The first year is typically the steepest. Most new luxury vehicles lose 15–25% of their value in year one. By year three, cumulative depreciation for mainstream luxury brands — BMW, Mercedes-Benz, Audi — often reaches 40–50%. By year five, 55–65% is common. A $80,000 vehicle held for five years can be worth $28,000–$36,000 at resale, representing $44,000–$52,000 in depreciation alone — roughly $700–$860 per month before any other cost is counted.

Brands and models vary significantly. Land Rover has historically shown some of the steepest depreciation curves in the luxury segment. Toyota’s Lexus brand and Porsche (particularly the 911 and SUV lines) consistently rank among the best at value retention. The full picture of which specific models hold value best lives in resale value, which approaches the question from the exit rather than the entry.

For buyers who want to minimize depreciation exposure, purchasing a certified pre-owned vehicle 2–3 years old shifts the steepest portion of the depreciation curve to the previous owner. That decision intersects directly with the buy vs. lease analysis, where the depreciation assumption is built into every lease payment. The Luxury Spending pillar covers how depreciation fits into the total cost picture alongside car ownership and auto insurance.

A geometric vector illustration showing a luxury car driving down an angled plane, representing price depreciation over five years.

5-Year Depreciation on $100k Luxury Cars

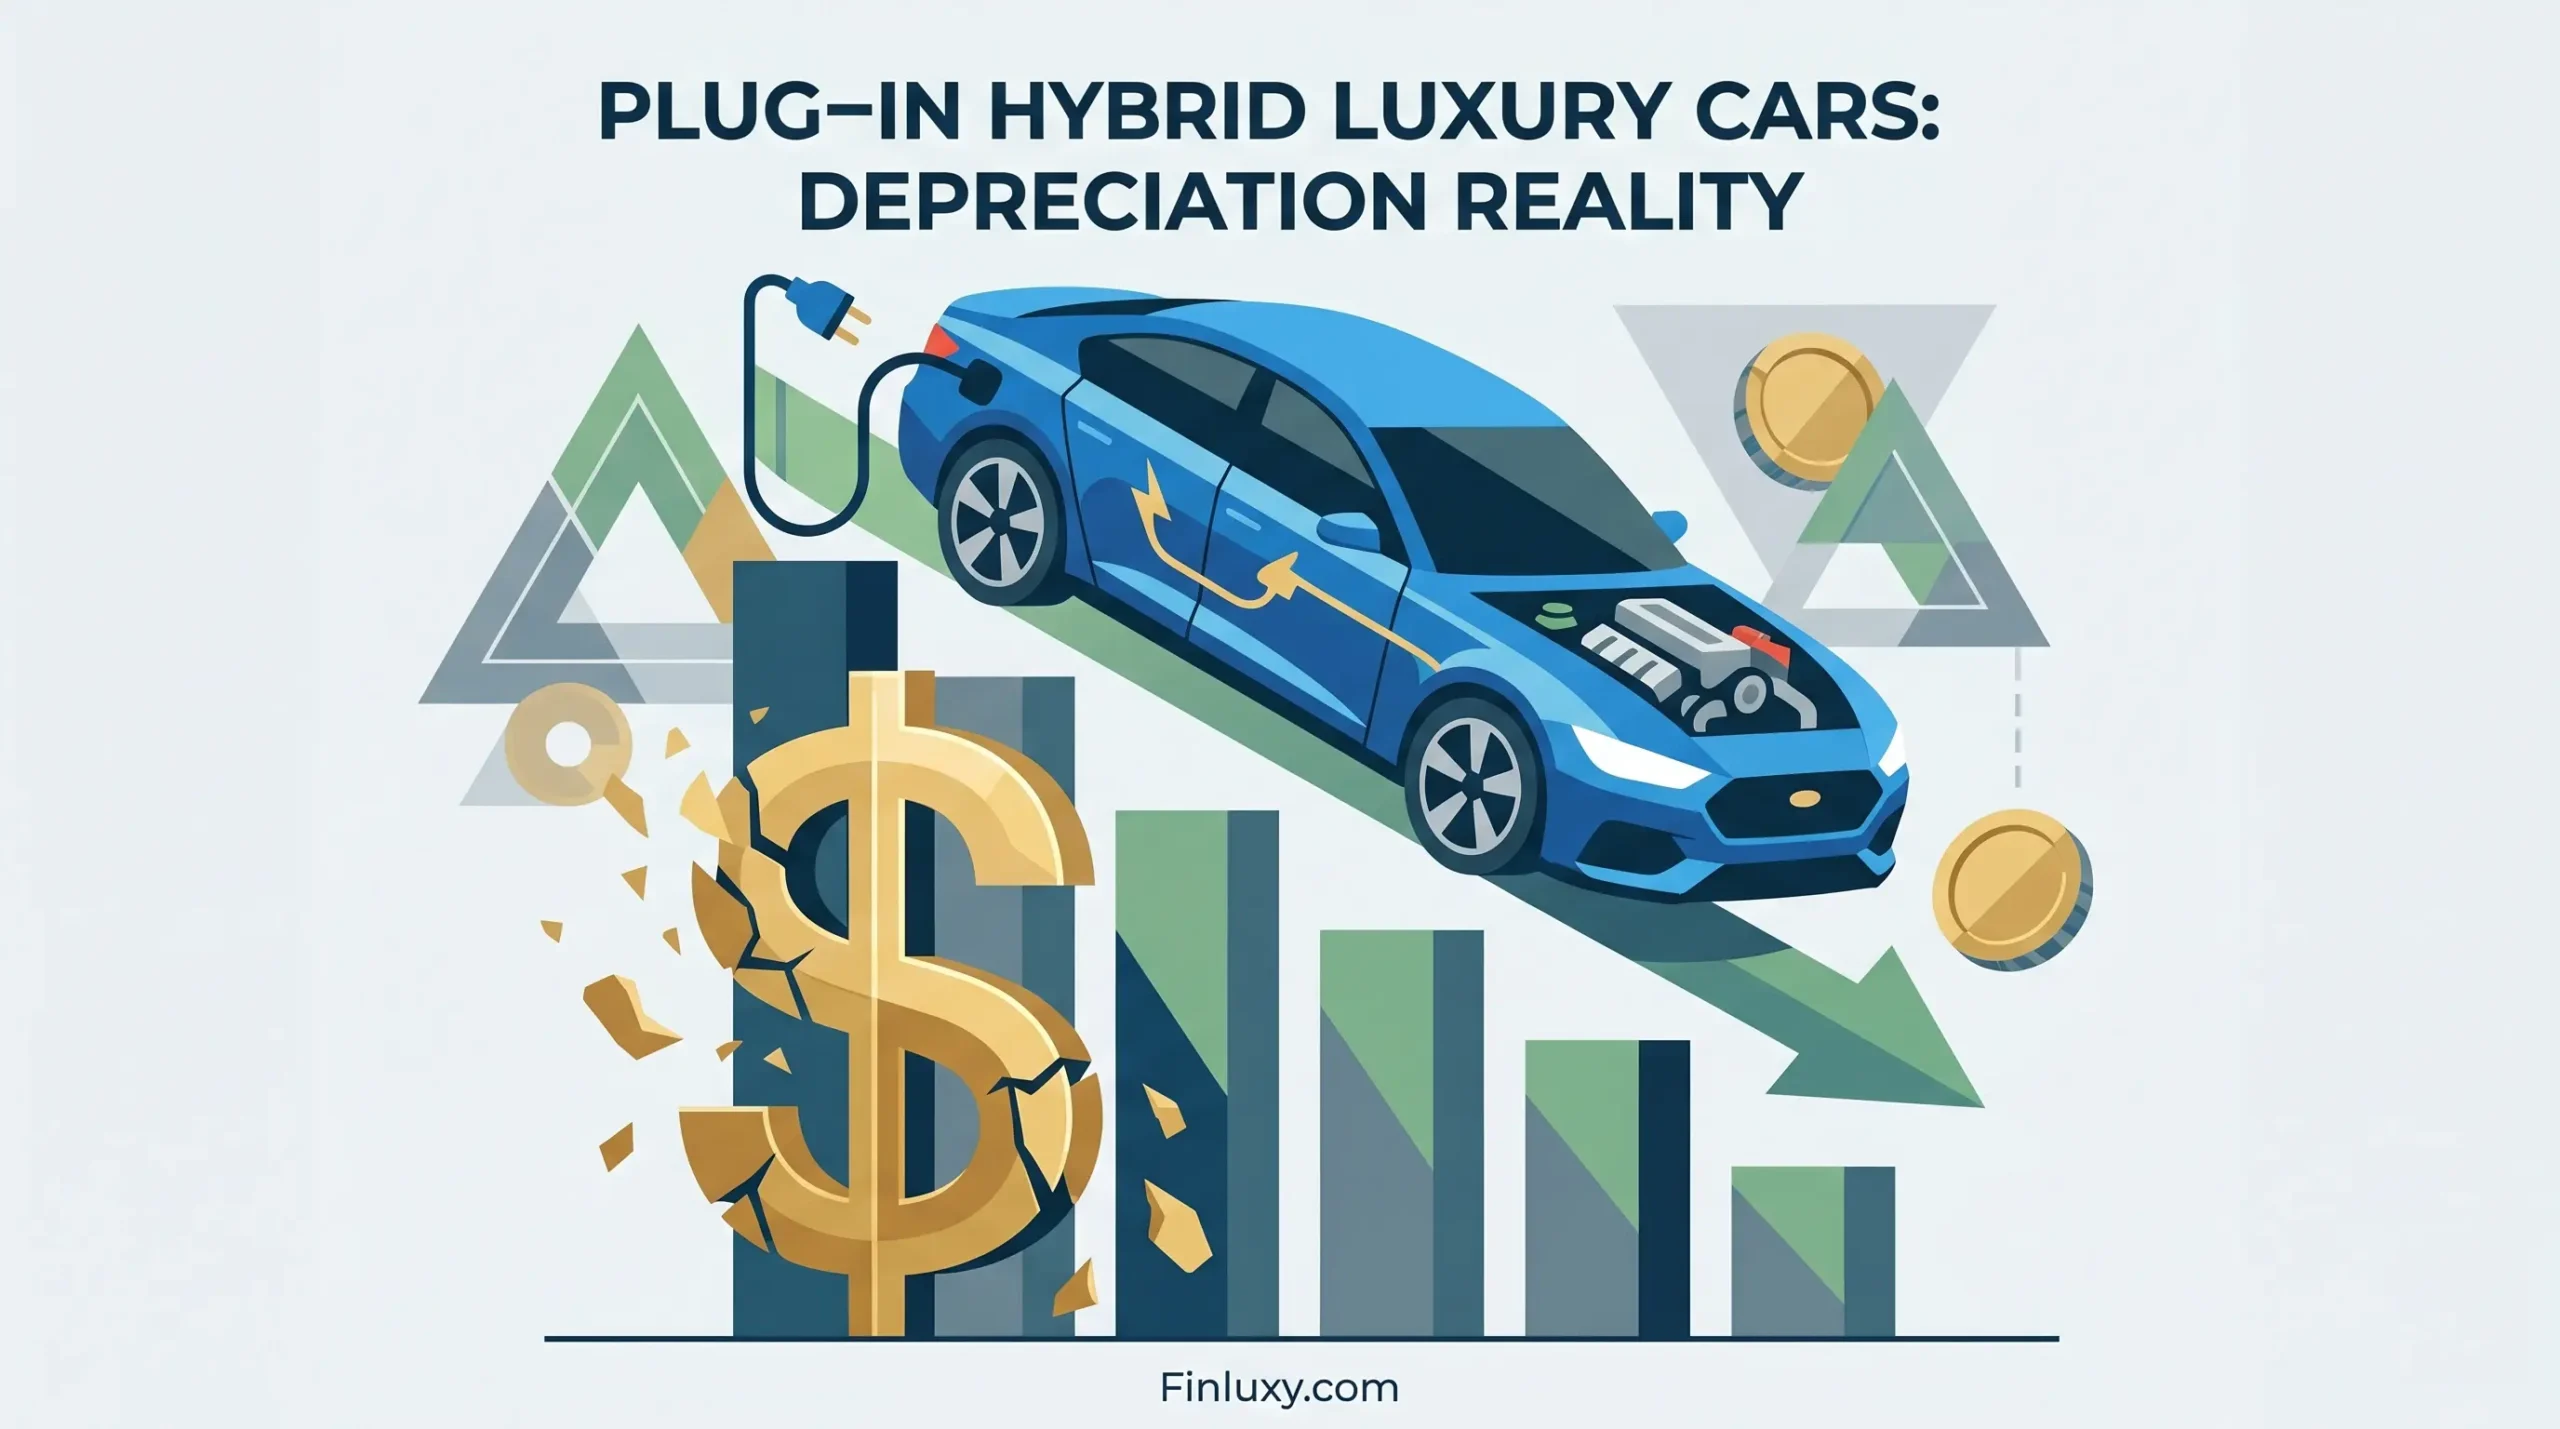
Geometric illustration of a blue plug-in hybrid luxury car driving down a declining arrow, next to a crumbling dollar sign.

Plug-In Hybrid Luxury Cars: Depreciation Reality

A modern vector illustration comparing a hypercar and a sports car with financial icons, titled Exotic Car Depreciation.

Exotic Car Depreciation: Hypercar vs Sports Car

Geometric vector illustration comparing luxury car resale value and depreciation with cars and coin stacks.

Luxury Car Depreciation Guide: Which Cars Hold Value

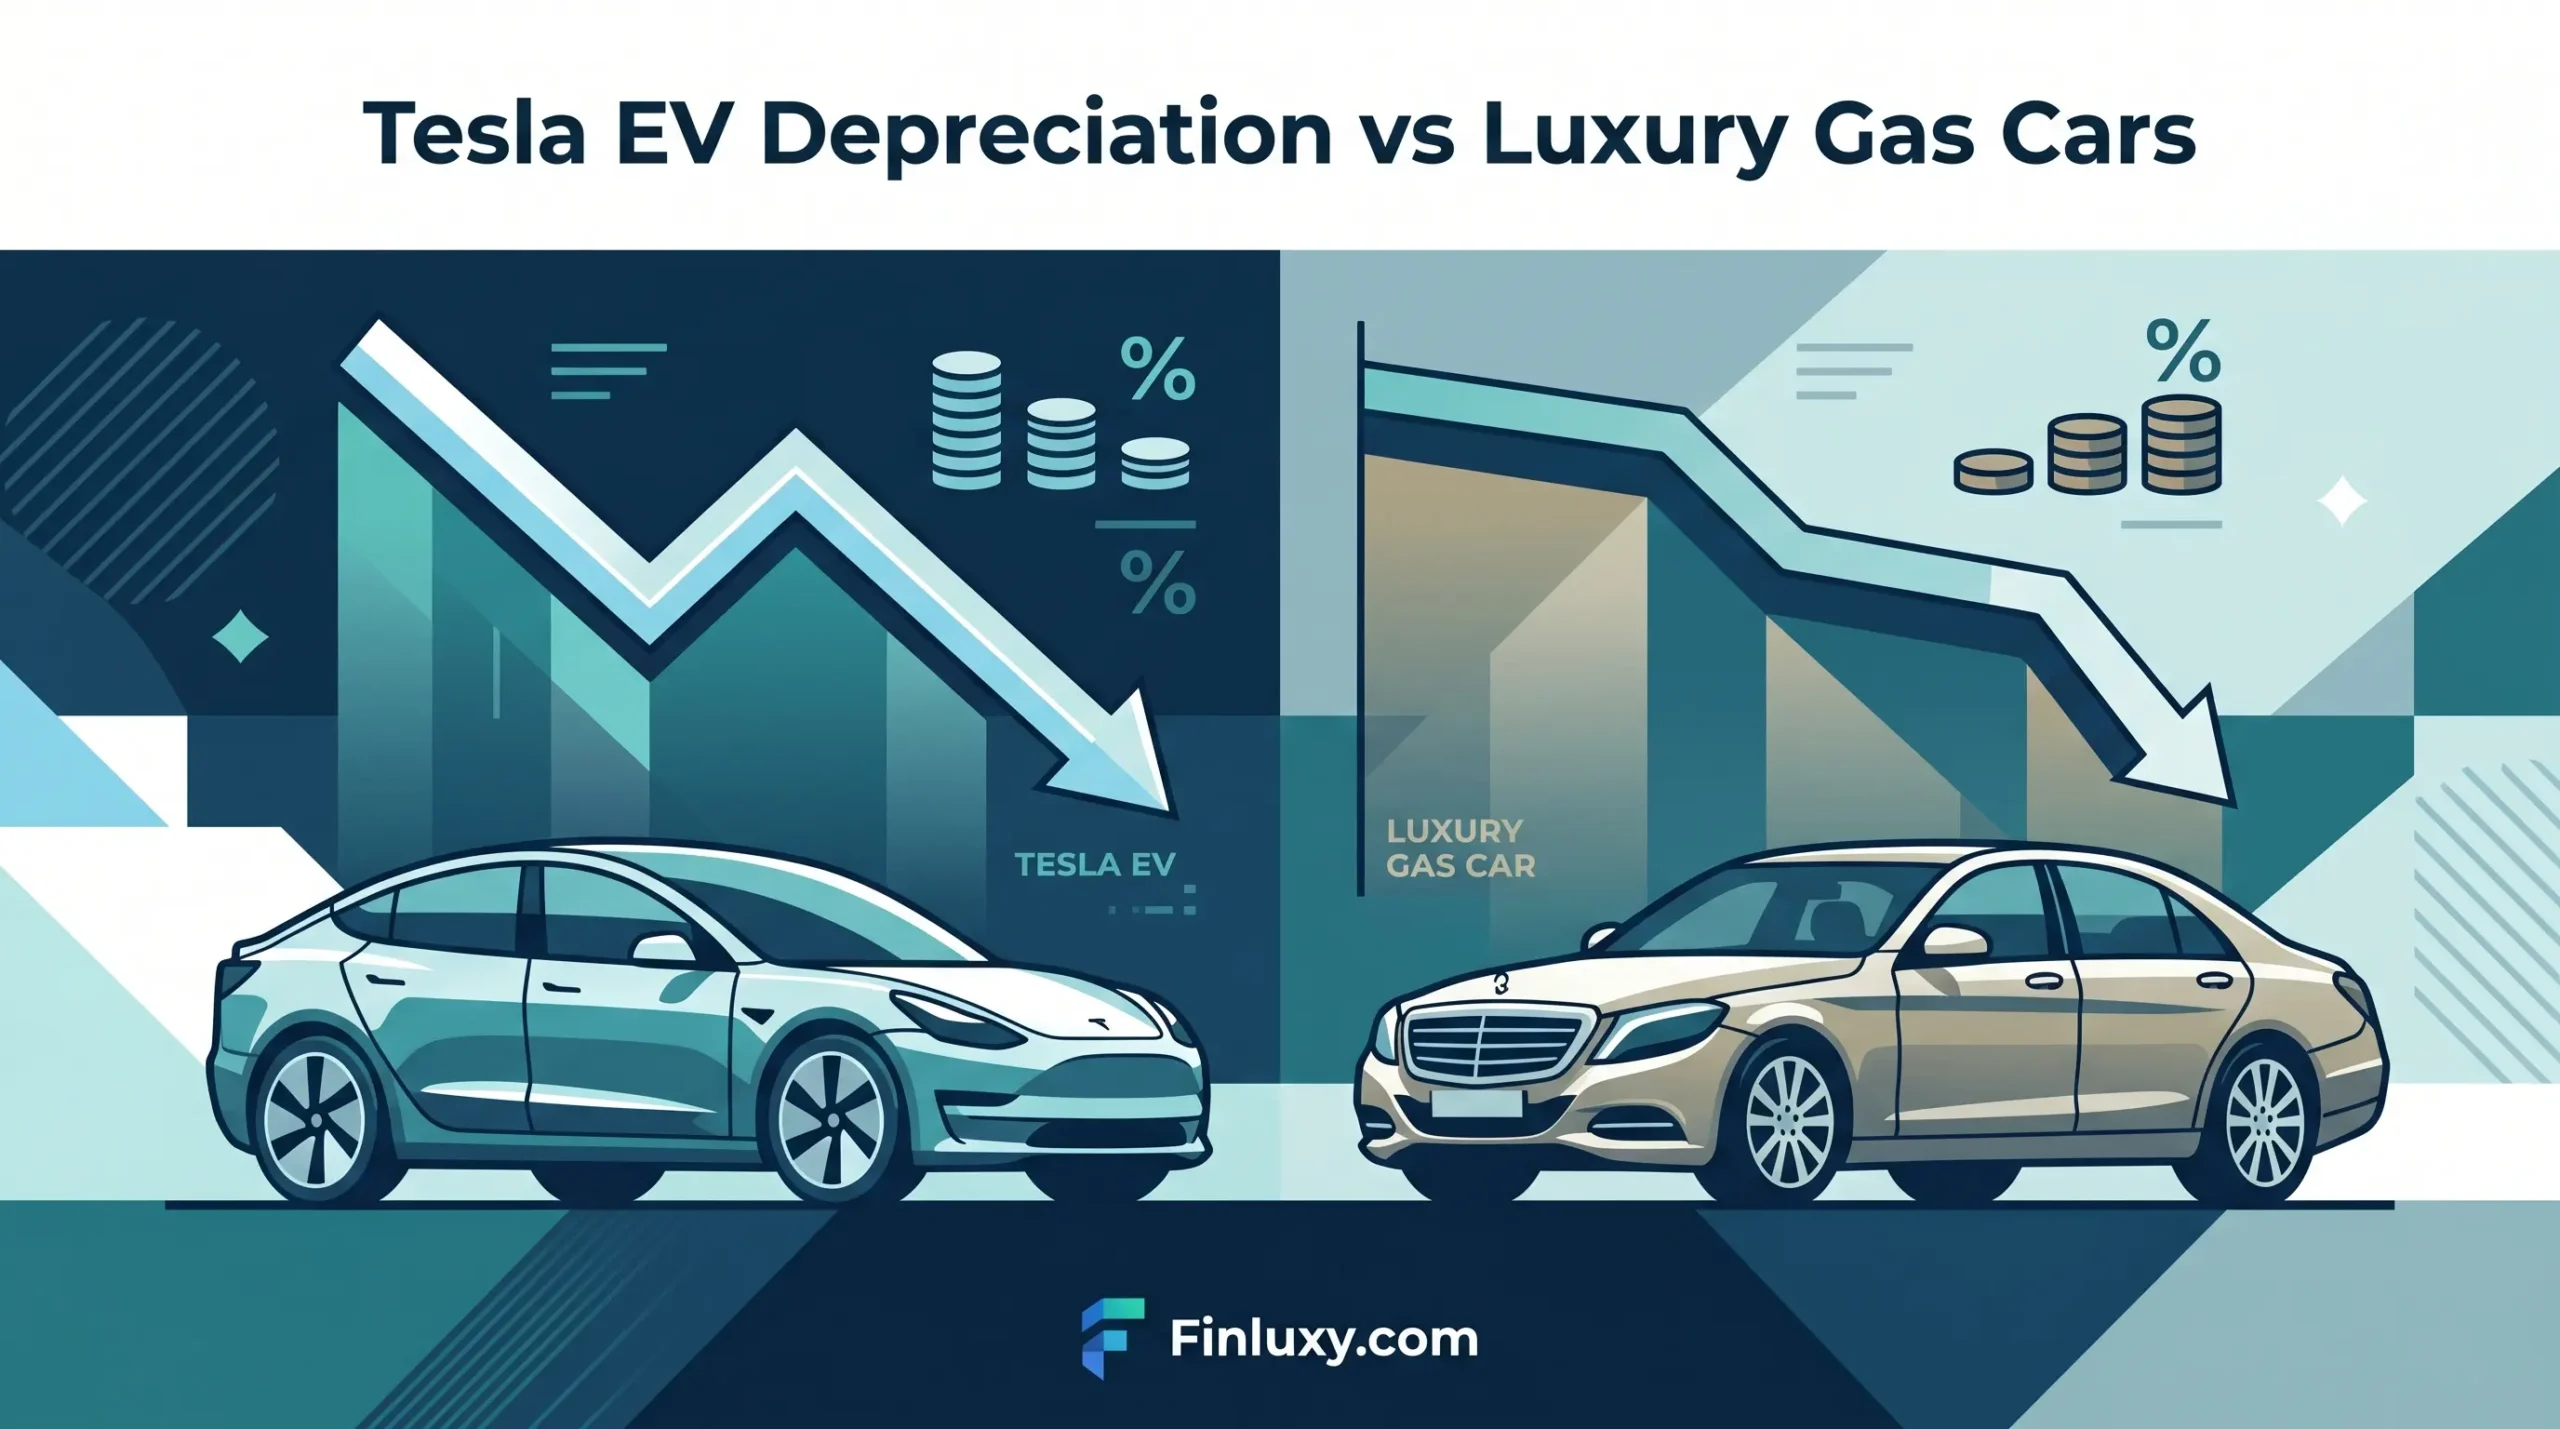
A comparison of depreciation trends between a Tesla EV and a luxury gasoline car, shown with downward arrows on split geometric charts. Finluxy.com logo at the bottom.

Tesla EV Depreciation vs Luxury Gas Cars

Geometric illustration showing a car's resale value increasing with stylized color segments, leather seats, and sunroof options.

Color and Options Impact on Resale Value

A vector illustration with a Land Rover and a Volvo car on graphs showing declining value over time for a depreciation analysis.

Land Rover vs Volvo: Depreciation Rate Gap

Geometric illustration shows a car on a timeline at the 3-year point, highlighting peak value for Finluxy.com.

Buying at Peak Depreciation: The 3-Year Sweet Spot

Geometric illustration of a luxury car, watch, and declining gold arrow, representing first-year asset depreciation for Finluxy.com.

How First-Year Depreciation Hits Luxury Buyers

Geometric illustration shows a luxury SUV on a road that crumbles into a void of falling money, with the header 'Which Luxury SUVs Depreciate Fastest?'.

Which Luxury SUVs Depreciate Fastest? (2026 Data)

A modern vector infographic showing a BMW 7 Series depreciating in value over five years, from Finluxy.com.

BMW 7 Series Depreciation Curve: Year by Year

Geometric illustration showing a luxury car, a mileage gauge, and a descending graph indicating depreciation. Finluxy.com.

How Mileage Affects Luxury Car Depreciation Rate

A geometric infographic comparing car depreciation, featuring the headline "German vs Japanese Luxury: Depreciation Race" and Finluxy.com.

German vs Japanese Luxury: Depreciation Race

Geometric vector illustration comparing Mercedes S-Class and Lexus LS depreciation, with downward trend arrows and Finluxy.com logo.

Mercedes S-Class vs Lexus LS: Depreciation Compared

Geometric vector graphic of a luxury sports car ascending a graph, illustrating Porsche value retention for Finluxy.com.

Porsche Holds Value: The Depreciation Data Behind It

A stylized geometric illustration of a luxury car on a pedestal with the text 'Limited Edition Models: Do They Hold Value Better?' on a dark blue background with coins.

Limited Edition Models: Do They Hold Value Better?

  • About
  • Privacy Policy
  • Editorial Policy
  • Disclaimer
  • Affiliate Disclosure
  • Terms of Use
  • Contact
© 2026 Finluxy. All Rights Reserved.